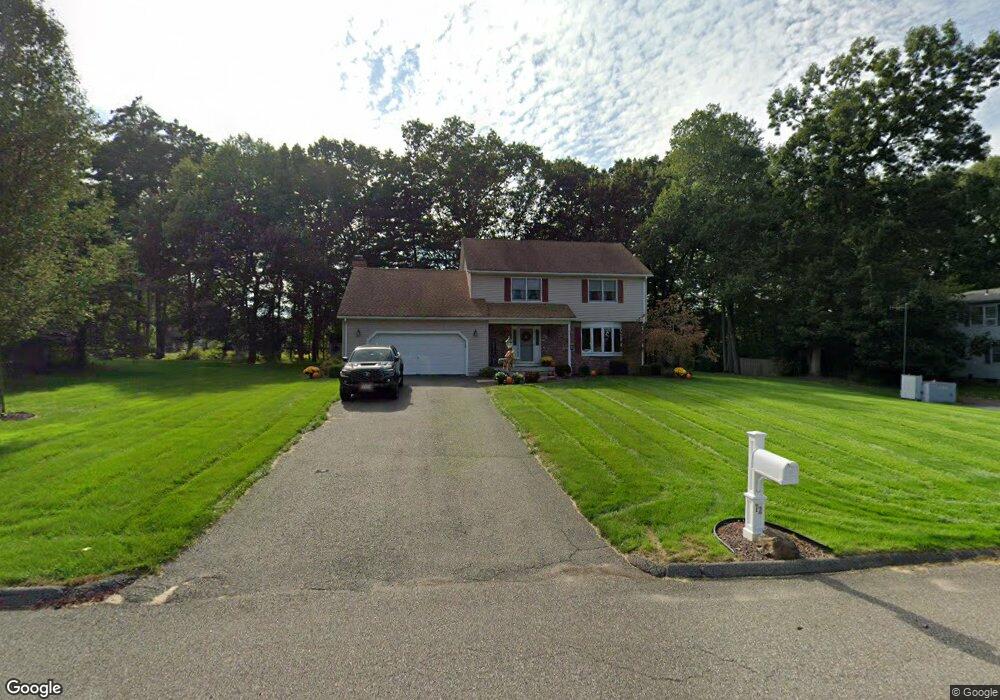
72 Dawes St East Longmeadow, MA 01028
Estimated Value: $464,522 - $664,000
3
Beds
2
Baths
2,015
Sq Ft
$261/Sq Ft
Est. Value
About This Home
This home is located at 72 Dawes St, East Longmeadow, MA 01028 and is currently estimated at $525,131, approximately $260 per square foot. 72 Dawes St is a home located in Hampden County with nearby schools including Meadowbrook Elementary School, Birchland Park Middle School, and East Longmeadow High School.
Ownership History
Date
Name
Owned For
Owner Type
Purchase Details
Closed on
Dec 28, 2004
Sold by
Carrano Alfonso R and Carrano Antonietta A
Bought by
Huckins Janet M and Huckins Paul E
Current Estimated Value
Home Financials for this Owner
Home Financials are based on the most recent Mortgage that was taken out on this home.
Original Mortgage
$253,000
Outstanding Balance
$127,651
Interest Rate
5.74%
Mortgage Type
Purchase Money Mortgage
Estimated Equity
$397,480
Purchase Details
Closed on
Jun 30, 2004
Sold by
Daponte Immacolata and Daponte Louis M
Bought by
Carrano Alfonso R and Carrano Antonietta A
Home Financials for this Owner
Home Financials are based on the most recent Mortgage that was taken out on this home.
Original Mortgage
$256,000
Interest Rate
6.3%
Mortgage Type
Purchase Money Mortgage
Purchase Details
Closed on
Dec 6, 2000
Sold by
Davies Michael J
Bought by
Daponte Louis M and Daponte Immacolata
Create a Home Valuation Report for This Property
The Home Valuation Report is an in-depth analysis detailing your home's value as well as a comparison with similar homes in the area
Home Values in the Area
Average Home Value in this Area
Purchase History
| Date | Buyer | Sale Price | Title Company |
|---|---|---|---|
| Huckins Janet M | $349,900 | -- | |
| Carrano Alfonso R | $280,000 | -- | |
| Daponte Louis M | $212,500 | -- |
Source: Public Records
Mortgage History
| Date | Status | Borrower | Loan Amount |
|---|---|---|---|
| Open | Huckins Janet M | $253,000 | |
| Previous Owner | Carrano Alfonso R | $256,000 |
Source: Public Records
Tax History Compared to Growth
Tax History
| Year | Tax Paid | Tax Assessment Tax Assessment Total Assessment is a certain percentage of the fair market value that is determined by local assessors to be the total taxable value of land and additions on the property. | Land | Improvement |
|---|---|---|---|---|
| 2025 | $7,520 | $406,900 | $99,900 | $307,000 |
| 2024 | $7,106 | $383,300 | $99,900 | $283,400 |
| 2023 | $6,776 | $352,900 | $90,500 | $262,400 |
| 2022 | $6,454 | $318,100 | $81,500 | $236,600 |
| 2021 | $6,362 | $302,100 | $75,400 | $226,700 |
| 2020 | $6,154 | $295,300 | $75,400 | $219,900 |
| 2019 | $5,898 | $287,000 | $73,200 | $213,800 |
| 2018 | $5,729 | $273,600 | $73,200 | $200,400 |
| 2017 | $5,531 | $266,300 | $71,600 | $194,700 |
| 2016 | $5,536 | $262,100 | $69,500 | $192,600 |
| 2015 | $5,431 | $262,100 | $69,500 | $192,600 |
Source: Public Records
Map
Nearby Homes
- 331 Newhouse St
- 15 Lynwood Rd
- 19 Westminster St
- 399 Elm St
- 41 Kerry Dr
- 82 Louis Rd
- 41 Hillside Dr
- 206 Treetop Ave
- 17 Pebble Mill Rd
- 86 Talmadge Dr
- 54 Shady Brook Ln
- 19 Fairview St
- 43 Sunridge Dr
- 56 Hadley St
- 125 Manor Ct Unit 125
- 157 Canterbury Rd
- 55 Allen St
- 261 W Allen Ridge Rd
- 392 Gifford St
- 19 Manor Ct Unit 19