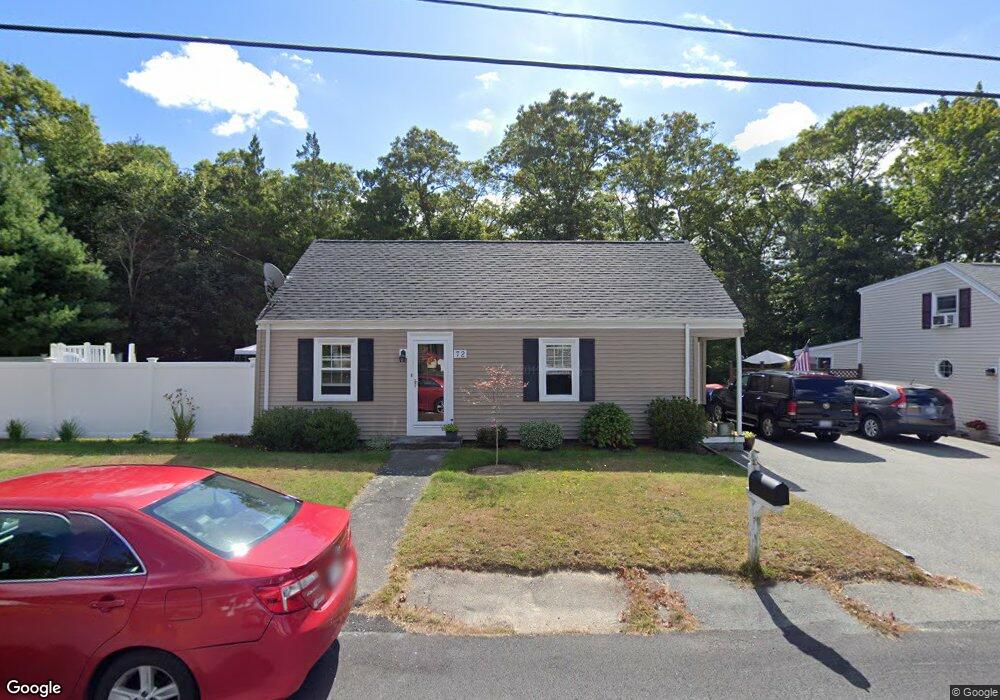
72 E Briggs Rd Westport, MA 02790
North Westport NeighborhoodEstimated Value: $447,043 - $526,000
3
Beds
--
Bath
1,352
Sq Ft
$351/Sq Ft
Est. Value
About This Home
This home is located at 72 E Briggs Rd, Westport, MA 02790 and is currently estimated at $474,014, approximately $350 per square foot. 72 E Briggs Rd is a home located in Bristol County with nearby schools including Alice A. Macomber Primary School, Westport Elementary School, and Westport Middle-High School.
Ownership History
Date
Name
Owned For
Owner Type
Purchase Details
Closed on
Jul 19, 2013
Sold by
Figueiredo 3Rd John P and Swartz Claudia M
Bought by
Medeiros Lori A
Current Estimated Value
Home Financials for this Owner
Home Financials are based on the most recent Mortgage that was taken out on this home.
Original Mortgage
$90,000
Outstanding Balance
$64,266
Interest Rate
3.5%
Mortgage Type
FHA
Estimated Equity
$409,748
Purchase Details
Closed on
Mar 24, 1998
Sold by
Skulte Dagnija Leja and Leja Dagnija
Bought by
Pritchard Frank P and Pritchard Nancy L
Create a Home Valuation Report for This Property
The Home Valuation Report is an in-depth analysis detailing your home's value as well as a comparison with similar homes in the area
Home Values in the Area
Average Home Value in this Area
Purchase History
| Date | Buyer | Sale Price | Title Company |
|---|---|---|---|
| Medeiros Lori A | $150,000 | -- | |
| Pritchard Frank P | $110,000 | -- |
Source: Public Records
Mortgage History
| Date | Status | Borrower | Loan Amount |
|---|---|---|---|
| Open | Medeiros Lori A | $90,000 | |
| Previous Owner | Pritchard Frank P | $20,000 | |
| Previous Owner | Pritchard Frank P | $8,600 | |
| Previous Owner | Pritchard Frank P | $10,000 |
Source: Public Records
Tax History Compared to Growth
Tax History
| Year | Tax Paid | Tax Assessment Tax Assessment Total Assessment is a certain percentage of the fair market value that is determined by local assessors to be the total taxable value of land and additions on the property. | Land | Improvement |
|---|---|---|---|---|
| 2025 | $2,704 | $363,000 | $156,800 | $206,200 |
| 2024 | $2,683 | $347,100 | $145,200 | $201,900 |
| 2023 | $2,704 | $331,400 | $132,300 | $199,100 |
| 2022 | $2,139 | $252,200 | $120,300 | $131,900 |
| 2021 | $3,834 | $236,500 | $109,400 | $127,100 |
| 2020 | $1,957 | $232,100 | $105,000 | $127,100 |
| 2019 | $1,862 | $225,200 | $105,000 | $120,200 |
| 2018 | $1,708 | $209,000 | $104,800 | $104,200 |
| 2017 | $1,652 | $207,300 | $101,400 | $105,900 |
| 2016 | $1,580 | $199,700 | $98,100 | $101,600 |
| 2015 | $1,570 | $198,000 | $100,300 | $97,700 |
Source: Public Records
Map
Nearby Homes
- 116 Gifford Rd
- 20 Faulkner St
- 9 Kyle Jacob Rd
- 100 D Dr
- 0 Van Buren St
- 15 S Breault St
- 16 S Berryman St
- 3 Diane Way
- 565 Highland Ave
- 9 Register Ave
- 92 Benoit St
- 1276 Old Fall River Rd
- 33 William St
- 771 Sanford Rd
- 6 Beaulieu St
- 25 Beaulieu St
- 27 Dias Ave
- 19 Charles Joseph Dr
- 2 Donna Marie Dr
- 128 Old Bedford Rd