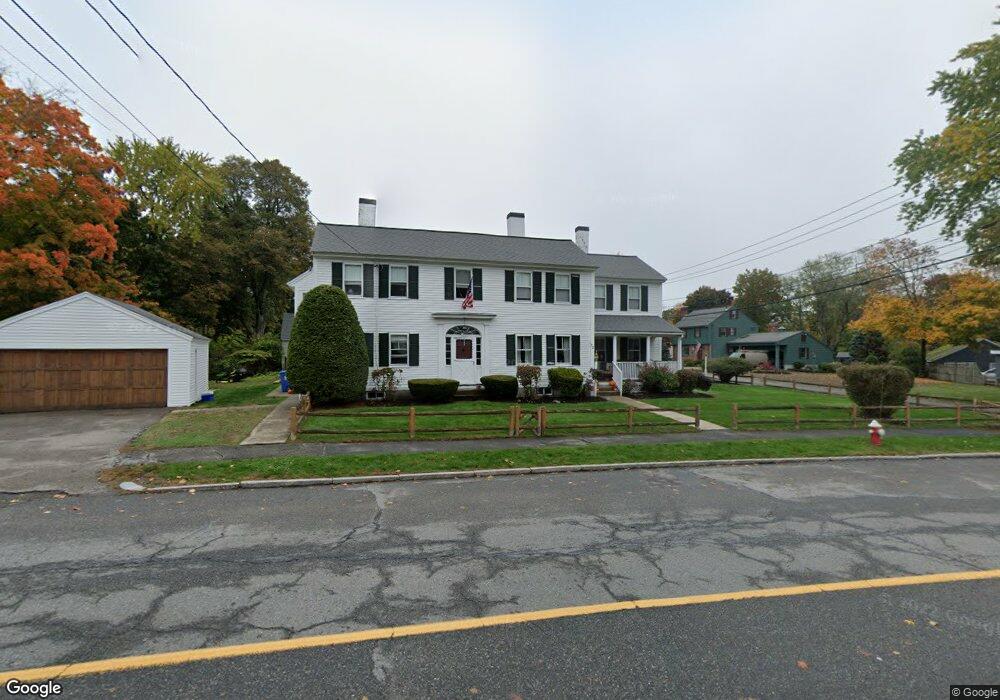
72 Elm St Unit 1 Wakefield, MA 01880
West Side NeighborhoodEstimated Value: $766,000 - $1,110,336
3
Beds
3
Baths
2,431
Sq Ft
$397/Sq Ft
Est. Value
About This Home
This home is located at 72 Elm St Unit 1, Wakefield, MA 01880 and is currently estimated at $964,584, approximately $396 per square foot. 72 Elm St Unit 1 is a home located in Middlesex County with nearby schools including Wakefield Memorial High School and St Joseph School.
Ownership History
Date
Name
Owned For
Owner Type
Purchase Details
Closed on
Mar 25, 2005
Sold by
Melanson Rt
Bought by
Melanson Elaine M
Current Estimated Value
Home Financials for this Owner
Home Financials are based on the most recent Mortgage that was taken out on this home.
Original Mortgage
$260,000
Outstanding Balance
$132,415
Interest Rate
5.78%
Mortgage Type
Purchase Money Mortgage
Estimated Equity
$832,169
Purchase Details
Closed on
Feb 18, 2005
Sold by
Melanson Rt
Bought by
Melanson Howard E and Melanson Keri N
Home Financials for this Owner
Home Financials are based on the most recent Mortgage that was taken out on this home.
Original Mortgage
$260,000
Outstanding Balance
$132,415
Interest Rate
5.78%
Mortgage Type
Purchase Money Mortgage
Estimated Equity
$832,169
Create a Home Valuation Report for This Property
The Home Valuation Report is an in-depth analysis detailing your home's value as well as a comparison with similar homes in the area
Home Values in the Area
Average Home Value in this Area
Purchase History
| Date | Buyer | Sale Price | Title Company |
|---|---|---|---|
| Melanson Elaine M | -- | -- | |
| Melanson Howard E | $360,000 | -- |
Source: Public Records
Mortgage History
| Date | Status | Borrower | Loan Amount |
|---|---|---|---|
| Open | Melanson Howard E | $260,000 |
Source: Public Records
Tax History Compared to Growth
Tax History
| Year | Tax Paid | Tax Assessment Tax Assessment Total Assessment is a certain percentage of the fair market value that is determined by local assessors to be the total taxable value of land and additions on the property. | Land | Improvement |
|---|---|---|---|---|
| 2025 | $10,720 | $944,500 | $417,300 | $527,200 |
| 2024 | $10,319 | $917,200 | $405,000 | $512,200 |
| 2023 | $9,979 | $850,700 | $375,000 | $475,700 |
| 2022 | $9,550 | $775,200 | $340,900 | $434,300 |
| 2021 | $8,837 | $694,200 | $318,100 | $376,100 |
| 2020 | $8,500 | $665,600 | $305,000 | $360,600 |
| 2019 | $8,246 | $642,700 | $294,500 | $348,200 |
| 2018 | $7,805 | $602,700 | $276,100 | $326,600 |
| 2017 | $7,478 | $573,900 | $262,900 | $311,000 |
| 2016 | $6,969 | $516,600 | $243,900 | $272,700 |
| 2015 | $6,526 | $484,100 | $228,000 | $256,100 |
| 2014 | $6,001 | $469,600 | $220,900 | $248,700 |
Source: Public Records
Map
Nearby Homes
- 10 Wolcott St
- 20 N Emerson St Unit 20
- 4 Mcdonald Farm Rd
- 26 Curve St
- 40 Friend St
- 114 Parker Rd
- 90 Prospect St
- 47 Emerson St
- 34 Cedar St
- 4 Adams St
- 6 Avon Ct Unit 2
- 2 Summit Dr Unit 18
- 1 Summit Dr Unit 57
- 50 Quannapowitt Pkwy
- 347 Ash St
- 10 Converse St
- 9 Avon St Unit 2
- 50 Albion St
- 24 Park St
- 5 Byron St