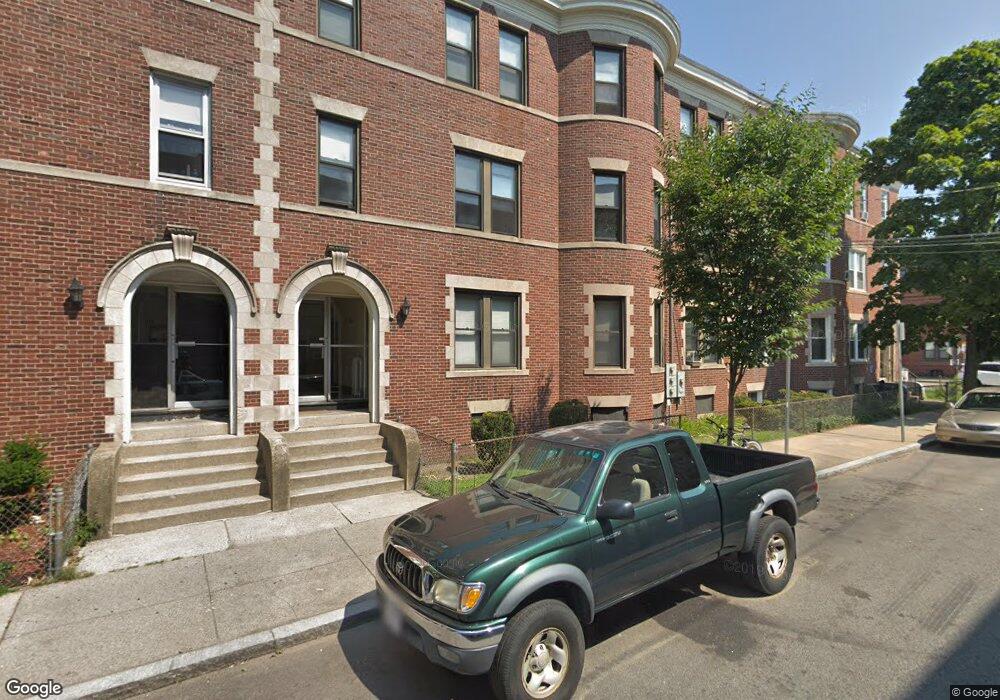
72 Empire St Allston, MA 02134
Allston NeighborhoodEstimated Value: $1,434,000 - $1,479,000
3
Beds
3
Baths
1,400
Sq Ft
$1,044/Sq Ft
Est. Value
About This Home
3 bed 2 bath located in Allston. Easy access to downtown and public transportation!
Ownership History
Date
Name
Owned For
Owner Type
Purchase Details
Closed on
Feb 9, 2018
Sold by
Wong Ft
Bought by
Empire T
Current Estimated Value
Purchase Details
Closed on
Mar 1, 1991
Sold by
Chow Chun K and Chow Tsun K
Bought by
Pang Tian Y and Pang Bga N
Home Financials for this Owner
Home Financials are based on the most recent Mortgage that was taken out on this home.
Original Mortgage
$140,000
Interest Rate
9.69%
Mortgage Type
Purchase Money Mortgage
Create a Home Valuation Report for This Property
The Home Valuation Report is an in-depth analysis detailing your home's value as well as a comparison with similar homes in the area
Home Values in the Area
Average Home Value in this Area
Purchase History
| Date | Buyer | Sale Price | Title Company |
|---|---|---|---|
| Empire T | $550,000 | -- | |
| Pang Tian Y | $240,000 | -- |
Source: Public Records
Mortgage History
| Date | Status | Borrower | Loan Amount |
|---|---|---|---|
| Previous Owner | Pang Tian Y | $140,000 |
Source: Public Records
Property History
| Date | Event | Price | List to Sale | Price per Sq Ft |
|---|---|---|---|---|
| 11/30/2024 11/30/24 | For Rent | $3,800 | +8.6% | -- |
| 10/08/2024 10/08/24 | Off Market | $3,500 | -- | -- |
| 10/08/2024 10/08/24 | Off Market | $3,800 | -- | -- |
| 11/16/2023 11/16/23 | For Rent | $3,500 | -- | -- |
Tax History Compared to Growth
Tax History
| Year | Tax Paid | Tax Assessment Tax Assessment Total Assessment is a certain percentage of the fair market value that is determined by local assessors to be the total taxable value of land and additions on the property. | Land | Improvement |
|---|---|---|---|---|
| 2025 | $14,894 | $1,286,200 | $284,000 | $1,002,200 |
| 2024 | $13,780 | $1,264,200 | $302,300 | $961,900 |
| 2023 | $13,054 | $1,215,500 | $290,700 | $924,800 |
| 2022 | $12,594 | $1,157,500 | $276,800 | $880,700 |
| 2021 | $12,109 | $1,134,900 | $271,400 | $863,500 |
| 2020 | $11,547 | $1,093,500 | $269,200 | $824,300 |
| 2019 | $10,774 | $1,022,200 | $193,000 | $829,200 |
| 2018 | $10,203 | $973,600 | $193,000 | $780,600 |
| 2017 | $9,547 | $901,500 | $193,000 | $708,500 |
| 2016 | $8,626 | $784,200 | $193,000 | $591,200 |
| 2015 | $7,845 | $647,800 | $144,900 | $502,900 |
| 2014 | $7,086 | $563,300 | $144,900 | $418,400 |
Source: Public Records
Map
Nearby Homes
- 22 Royal St
- 27 Coolidge Rd Unit 1
- 11 Easton St
- 106 Chester St Unit 3
- 1 Highgate St
- 8 Franklin St Unit 202
- 8 Franklin St Unit 403
- 8 Franklin St Unit 401
- 4 Franklin St Unit 403
- 59 Brighton Ave Unit 1
- 57 Brighton Ave Unit C
- 57 Brighton Ave Unit B
- 57 Brighton Ave Unit A
- 178 Brighton Ave Unit 12
- 56 Park Vale Ave Unit 4
- 54-60 Holton St Unit 58
- 20 Penniman Rd Unit 208
- 30 Penniman Rd Unit 201
- 53 Quint Ave
- 15 N Beacon St Unit 328
- 72 Empire St Unit 62 empire unit 2
- 72 Empire St Unit 2
- 72 Empire St Unit 1
- 72 Empire St Unit 3
- 76 Empire St
- 76 Empire St Unit 4
- 76 Empire St Unit 1
- 76 Empire St Unit 2
- 76 Empire St Unit 3
- 70 Empire St
- 70 Empire St
- 70 Empire St Unit 3
- 70 Empire St Unit 2
- 70 Empire St Unit 1
- 67 Hooker St Unit 69
- 81 Empire St Unit 4
- 81 Empire St Unit 6
- 81 Empire St Unit 9
- 81 Empire St
- 77 Empire St