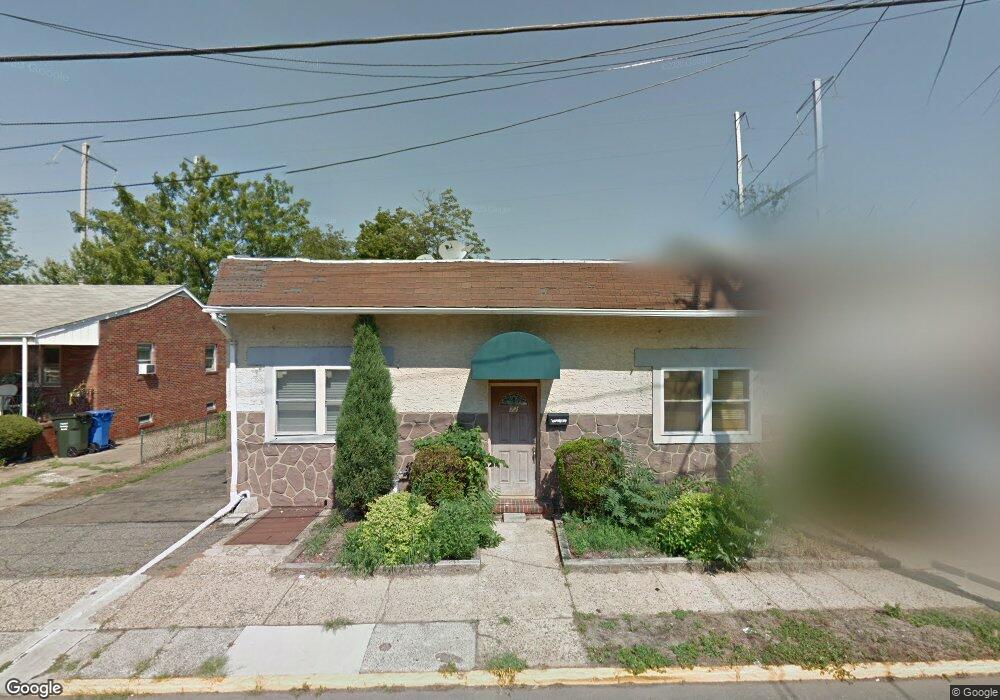
72 Fulton St Woodbridge, NJ 07095
Estimated Value: $430,257 - $695,000
--
Bed
--
Bath
3,150
Sq Ft
$171/Sq Ft
Est. Value
About This Home
This home is located at 72 Fulton St, Woodbridge, NJ 07095 and is currently estimated at $538,814, approximately $171 per square foot. 72 Fulton St is a home located in Middlesex County with nearby schools including Ross Street Elementary School, Woodbridge Middle School, and Woodbridge High School.
Ownership History
Date
Name
Owned For
Owner Type
Purchase Details
Closed on
May 12, 2004
Sold by
Mattsson Julie
Bought by
Dauti Luan and Dauti Hurman
Current Estimated Value
Home Financials for this Owner
Home Financials are based on the most recent Mortgage that was taken out on this home.
Original Mortgage
$110,000
Outstanding Balance
$51,466
Interest Rate
5.47%
Estimated Equity
$487,348
Purchase Details
Closed on
Sep 26, 2003
Sold by
Mattsson Maryanne
Bought by
Mattsson Julie
Purchase Details
Closed on
Apr 17, 1999
Sold by
Teitel Sheilah
Bought by
Mattsson Maryanne
Create a Home Valuation Report for This Property
The Home Valuation Report is an in-depth analysis detailing your home's value as well as a comparison with similar homes in the area
Home Values in the Area
Average Home Value in this Area
Purchase History
| Date | Buyer | Sale Price | Title Company |
|---|---|---|---|
| Dauti Luan | $140,000 | -- | |
| Mattsson Julie | -- | -- | |
| Mattsson Maryanne | $110,000 | -- |
Source: Public Records
Mortgage History
| Date | Status | Borrower | Loan Amount |
|---|---|---|---|
| Open | Dauti Luan | $110,000 |
Source: Public Records
Tax History Compared to Growth
Tax History
| Year | Tax Paid | Tax Assessment Tax Assessment Total Assessment is a certain percentage of the fair market value that is determined by local assessors to be the total taxable value of land and additions on the property. | Land | Improvement |
|---|---|---|---|---|
| 2025 | $13,779 | $101,800 | $12,500 | $89,300 |
| 2024 | $13,438 | $101,800 | $12,500 | $89,300 |
| 2023 | $13,438 | $101,800 | $12,500 | $89,300 |
| 2022 | $12,619 | $101,800 | $12,500 | $89,300 |
| 2021 | $12,489 | $101,800 | $12,500 | $89,300 |
| 2020 | $12,078 | $101,800 | $12,500 | $89,300 |
| 2019 | $11,771 | $101,800 | $12,500 | $89,300 |
| 2018 | $11,462 | $101,800 | $12,500 | $89,300 |
| 2017 | $11,231 | $101,800 | $12,500 | $89,300 |
| 2016 | $11,124 | $101,800 | $12,500 | $89,300 |
| 2015 | $10,905 | $101,800 | $12,500 | $89,300 |
| 2014 | $10,645 | $18,100 | $12,500 | $5,600 |
Source: Public Records
Map
Nearby Homes