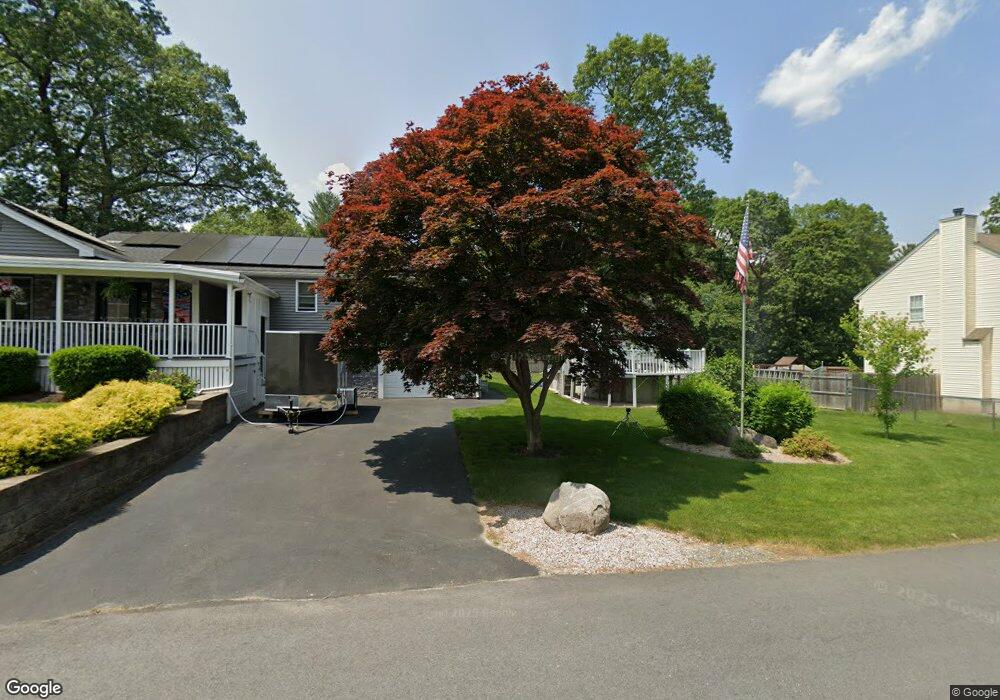
72 G St Dracut, MA 01826
Estimated Value: $541,000 - $605,000
4
Beds
2
Baths
1,580
Sq Ft
$362/Sq Ft
Est. Value
About This Home
This home is located at 72 G St, Dracut, MA 01826 and is currently estimated at $572,387, approximately $362 per square foot. 72 G St is a home located in Middlesex County with nearby schools including Brookside Elementary School, Richardson Middle School, and Dracut Senior High School.
Ownership History
Date
Name
Owned For
Owner Type
Purchase Details
Closed on
Jan 21, 2025
Sold by
Halko Stephen D and Halko Lyn M
Bought by
Stephen D & L M Halko Lt and Halko
Current Estimated Value
Purchase Details
Closed on
Nov 29, 1978
Bought by
Halko Stephen D and Tavares Lyn M
Create a Home Valuation Report for This Property
The Home Valuation Report is an in-depth analysis detailing your home's value as well as a comparison with similar homes in the area
Home Values in the Area
Average Home Value in this Area
Purchase History
| Date | Buyer | Sale Price | Title Company |
|---|---|---|---|
| Stephen D & L M Halko Lt | -- | None Available | |
| Stephen D & L M Halko Lt | -- | None Available | |
| Halko Stephen D | -- | -- |
Source: Public Records
Mortgage History
| Date | Status | Borrower | Loan Amount |
|---|---|---|---|
| Previous Owner | Halko Stephen D | $85,000 | |
| Previous Owner | Halko Stephen D | $20,000 | |
| Previous Owner | Halko Stephen D | $52,000 |
Source: Public Records
Tax History
| Year | Tax Paid | Tax Assessment Tax Assessment Total Assessment is a certain percentage of the fair market value that is determined by local assessors to be the total taxable value of land and additions on the property. | Land | Improvement |
|---|---|---|---|---|
| 2025 | $5,388 | $532,400 | $199,200 | $333,200 |
| 2024 | $5,362 | $513,100 | $189,700 | $323,400 |
| 2023 | $5,142 | $444,000 | $165,000 | $279,000 |
| 2022 | $5,103 | $415,200 | $149,900 | $265,300 |
| 2021 | $8,815 | $379,200 | $136,300 | $242,900 |
| 2020 | $4,729 | $354,200 | $132,300 | $221,900 |
| 2019 | $4,601 | $334,600 | $125,900 | $208,700 |
| 2018 | $7,567 | $311,100 | $125,900 | $185,200 |
| 2017 | $5,830 | $311,100 | $125,900 | $185,200 |
| 2016 | $4,053 | $273,100 | $121,100 | $152,000 |
| 2015 | $3,913 | $262,100 | $121,100 | $141,000 |
| 2014 | $3,637 | $251,000 | $121,100 | $129,900 |
Source: Public Records
Map
Nearby Homes
- 43 & 53 5th St
- 60 Robert St
- 17 Spare St
- 1905 Lakeview Ave
- 9 Cornstalk Ln
- 29 Mill St Unit B
- 26 Sagewood Dr Unit 26
- 13 Dallas Dr Unit 305
- 13 Dallas Dr Unit 107
- 70 Faith Ave
- 40 Westfall Rd
- 2 Aspen Dr
- 2 Aspen Dr Unit Lot 146-17
- 53 Vinal St
- 104 Long Pond Rd
- 1 Elm Grove Ave
- 6 Wilshire Ln Unit 6
- 4 Wilshire Ln Unit 4
- 4 Wilshire Ln
- 94 Tennis Plaza Rd Unit 10
Your Personal Tour Guide
Ask me questions while you tour the home.