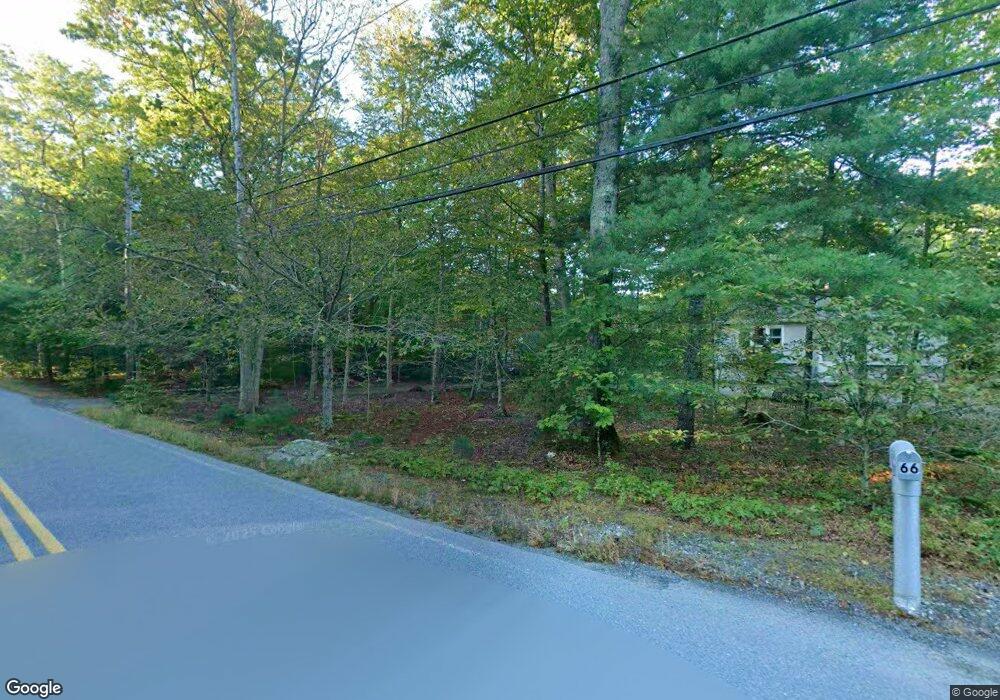
72 Gorham St Rehoboth, MA 02769
Estimated Value: $725,104 - $876,000
4
Beds
3
Baths
2,352
Sq Ft
$336/Sq Ft
Est. Value
About This Home
This home is located at 72 Gorham St, Rehoboth, MA 02769 and is currently estimated at $789,776, approximately $335 per square foot. 72 Gorham St is a home located in Bristol County with nearby schools including Dighton-Rehoboth Regional High School and Cedar Brook School.
Ownership History
Date
Name
Owned For
Owner Type
Purchase Details
Closed on
Apr 3, 2019
Sold by
Decrescenzo Dino and Decrescenzo Lori A
Bought by
Dino Decrescenzo Ret
Current Estimated Value
Purchase Details
Closed on
Feb 5, 1997
Sold by
Devine William J
Bought by
Decrescenzo Dino and Decrescenzo Lori Ann
Purchase Details
Closed on
May 17, 1996
Sold by
Baker Alfred W
Bought by
Nichols Rt and Devine William J
Create a Home Valuation Report for This Property
The Home Valuation Report is an in-depth analysis detailing your home's value as well as a comparison with similar homes in the area
Home Values in the Area
Average Home Value in this Area
Purchase History
| Date | Buyer | Sale Price | Title Company |
|---|---|---|---|
| Dino Decrescenzo Ret | -- | -- | |
| Decrescenzo Dino | $16,250 | -- | |
| Decrescenzo Dino | $16,250 | -- | |
| Decrescenzo Dino | $16,250 | -- | |
| Nichols Rt | $2,000 | -- | |
| Nichols Rt | $2,000 | -- |
Source: Public Records
Mortgage History
| Date | Status | Borrower | Loan Amount |
|---|---|---|---|
| Previous Owner | Nichols Rt | $144,352 | |
| Previous Owner | Nichols Rt | $91,000 | |
| Previous Owner | Nichols Rt | $100,000 |
Source: Public Records
Tax History
| Year | Tax Paid | Tax Assessment Tax Assessment Total Assessment is a certain percentage of the fair market value that is determined by local assessors to be the total taxable value of land and additions on the property. | Land | Improvement |
|---|---|---|---|---|
| 2025 | $69 | $618,100 | $201,200 | $416,900 |
| 2024 | $6,915 | $608,700 | $201,200 | $407,500 |
| 2023 | $6,422 | $554,600 | $197,200 | $357,400 |
| 2022 | $6,294 | $496,800 | $188,800 | $308,000 |
| 2021 | $0 | $454,800 | $172,500 | $282,300 |
| 2020 | $25,679 | $454,800 | $172,500 | $282,300 |
| 2018 | $3,012 | $427,200 | $164,700 | $262,500 |
| 2017 | $4,952 | $394,300 | $164,700 | $229,600 |
| 2016 | $4,791 | $394,300 | $164,700 | $229,600 |
| 2015 | $4,573 | $371,500 | $157,500 | $214,000 |
| 2014 | $4,532 | $364,300 | $150,300 | $214,000 |
Source: Public Records
Map
Nearby Homes
Your Personal Tour Guide
Ask me questions while you tour the home.