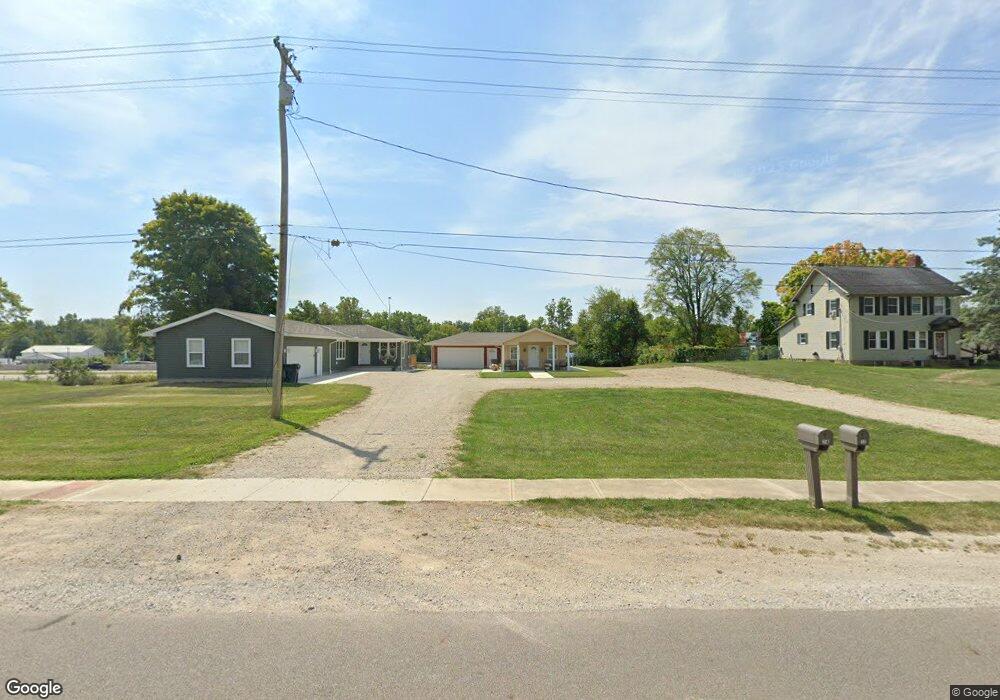
72 High St Carroll, OH 43112
Estimated Value: $264,707 - $331,000
3
Beds
2
Baths
1,314
Sq Ft
$231/Sq Ft
Est. Value
About This Home
This home is located at 72 High St, Carroll, OH 43112 and is currently estimated at $303,677, approximately $231 per square foot. 72 High St is a home located in Fairfield County with nearby schools including Bloom Carroll Primary School, Bloom Carroll Intermediate School, and Bloom-Carroll Middle School.
Ownership History
Date
Name
Owned For
Owner Type
Purchase Details
Closed on
Jun 23, 2023
Sold by
Poling Norma
Bought by
Poling Mitchell D
Current Estimated Value
Purchase Details
Closed on
Jun 9, 2023
Sold by
Lane Jeff
Bought by
J Johnson Investments Llc
Purchase Details
Closed on
Nov 7, 2019
Sold by
Poling Norma
Bought by
Poling Mitchell D
Purchase Details
Closed on
Apr 11, 2014
Sold by
Meade William F
Bought by
State Of Ohio
Purchase Details
Closed on
Sep 30, 2005
Sold by
Roark Randy L and Roark Teresa Marie
Bought by
Meade William F
Home Financials for this Owner
Home Financials are based on the most recent Mortgage that was taken out on this home.
Original Mortgage
$119,000
Interest Rate
6.12%
Mortgage Type
Fannie Mae Freddie Mac
Purchase Details
Closed on
Jan 1, 1987
Create a Home Valuation Report for This Property
The Home Valuation Report is an in-depth analysis detailing your home's value as well as a comparison with similar homes in the area
Purchase History
| Date | Buyer | Sale Price | Title Company |
|---|---|---|---|
| Poling Mitchell D | -- | None Listed On Document | |
| J Johnson Investments Llc | $308,000 | None Listed On Document | |
| Poling Mitchell D | -- | None Listed On Document | |
| State Of Ohio | $10,700 | None Available | |
| Meade William F | $140,000 | Lawyers Title Agency Of Lanc | |
| -- | $55,000 | -- |
Source: Public Records
Mortgage History
| Date | Status | Borrower | Loan Amount |
|---|---|---|---|
| Previous Owner | Meade William F | $119,000 |
Source: Public Records
Tax History
| Year | Tax Paid | Tax Assessment Tax Assessment Total Assessment is a certain percentage of the fair market value that is determined by local assessors to be the total taxable value of land and additions on the property. | Land | Improvement |
|---|---|---|---|---|
| 2025 | $5,053 | $82,740 | $36,040 | $46,700 |
| 2024 | $5,053 | $63,400 | $23,590 | $39,810 |
| 2023 | $2,801 | $63,400 | $23,590 | $39,810 |
| 2022 | $2,821 | $63,400 | $23,590 | $39,810 |
| 2021 | $2,026 | $44,700 | $19,660 | $25,040 |
| 2020 | $2,050 | $44,700 | $19,660 | $25,040 |
| 2019 | $2,059 | $44,700 | $19,660 | $25,040 |
| 2018 | $1,975 | $41,850 | $19,660 | $22,190 |
| 2017 | $1,855 | $44,070 | $19,660 | $24,410 |
| 2016 | $1,800 | $44,070 | $19,660 | $24,410 |
| 2015 | $1,714 | $40,880 | $19,660 | $21,220 |
| 2014 | $1,598 | $39,870 | $19,660 | $20,210 |
| 2013 | $1,598 | $29,050 | $6,150 | $22,900 |
Source: Public Records
Map
Nearby Homes
- 52 W Canal St
- 50 Market St
- 2155 Carroll-Southern Rd NW
- 5341 Carnes Rd NW
- 5699 Feldon Ct NW
- 3540 Carroll-Southern Rd NW
- 3510 Kauffman Rd NW
- 5840 High St NW
- 2291 Carroll-Southern Rd NW
- 6103 Pickerington Rd
- 2115 Lamb Rd NW
- 8322 Benson Rd
- 5560 Amanda Northern Rd NW
- 5840 Amanda Northern Rd NW
- 2270 Ginder Rd NW
- 7195 Alspach Rd NW
- 6625 Amanda Northern Rd
- 4315 Brook Rd NW
- 3355 Old Columbus Rd NW
- 5870 Brook Rd NW
- 72 & 74 High St
- 74 High St
- 70 High St
- 76 High St
- 68 High St
- 64 Center St
- 73 High St
- 4825 Columbus-Lancaster Rd NW
- 0 U S Route 33
- 3929 Columbus-Lancaster Rd NW
- 66 Center St
- 77 High St
- 78 High St
- 2570 Carroll-Southern Rd
- 3407 Carroll-Southern Rd
- 79 High St
- 61 Park St
- 81 High St
- 80 High St
- 78 Market St
Your Personal Tour Guide
Ask me questions while you tour the home.