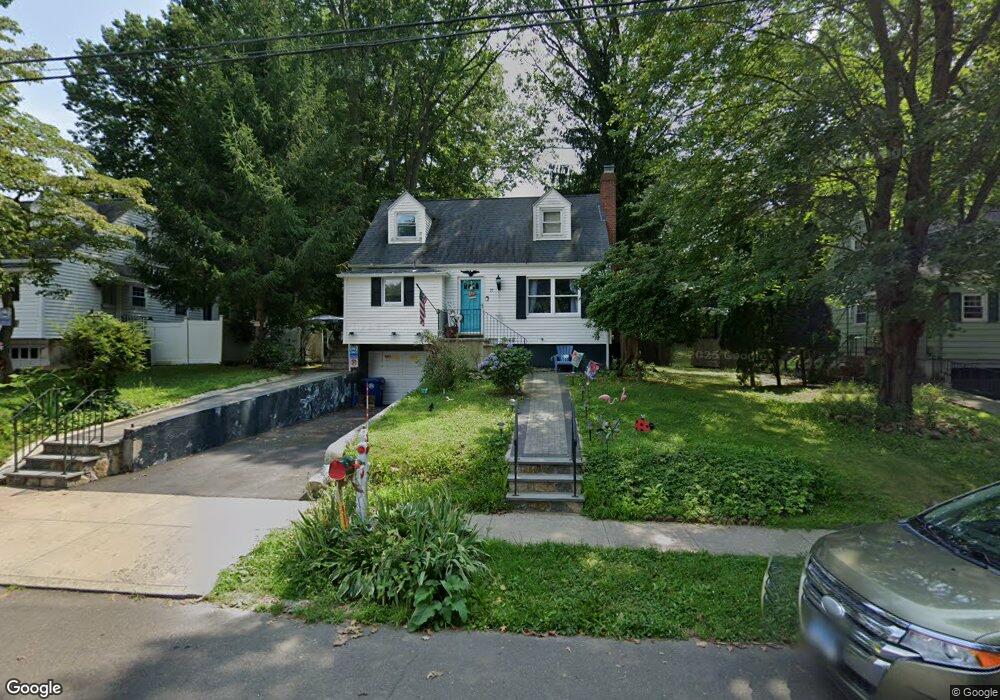
72 Hillside St West Haven, CT 06516
Allingtown NeighborhoodEstimated Value: $336,151 - $376,000
3
Beds
1
Bath
1,372
Sq Ft
$264/Sq Ft
Est. Value
About This Home
This home is located at 72 Hillside St, West Haven, CT 06516 and is currently estimated at $362,288, approximately $264 per square foot. 72 Hillside St is a home located in New Haven County with nearby schools including Carrigan 5/6 Intermediate School, Harry M. Bailey Middle School, and West Haven High School.
Ownership History
Date
Name
Owned For
Owner Type
Purchase Details
Closed on
Jan 28, 2026
Sold by
Calvi Betty K Est and Leon
Bought by
Reinheimer Talles
Current Estimated Value
Purchase Details
Closed on
Aug 2, 2007
Sold by
Mangles Joseph O and Mangles Eleohore
Bought by
Pettway Phillip and Wingate-Pettway Robin L
Home Financials for this Owner
Home Financials are based on the most recent Mortgage that was taken out on this home.
Original Mortgage
$238,000
Interest Rate
6.73%
Mortgage Type
Purchase Money Mortgage
Create a Home Valuation Report for This Property
The Home Valuation Report is an in-depth analysis detailing your home's value as well as a comparison with similar homes in the area
Home Values in the Area
Average Home Value in this Area
Purchase History
| Date | Buyer | Sale Price | Title Company |
|---|---|---|---|
| Reinheimer Talles | $255,000 | -- | |
| Pettway Phillip | $238,500 | -- | |
| Pettway Phillip | $238,500 | -- |
Source: Public Records
Mortgage History
| Date | Status | Borrower | Loan Amount |
|---|---|---|---|
| Previous Owner | Pettway Phillip | $238,000 | |
| Previous Owner | Pettway Phillip | $67,000 |
Source: Public Records
Tax History
| Year | Tax Paid | Tax Assessment Tax Assessment Total Assessment is a certain percentage of the fair market value that is determined by local assessors to be the total taxable value of land and additions on the property. | Land | Improvement |
|---|---|---|---|---|
| 2025 | $6,740 | $198,170 | $77,840 | $120,330 |
| 2024 | $6,188 | $129,220 | $53,970 | $75,250 |
| 2023 | $5,998 | $129,220 | $53,970 | $75,250 |
| 2022 | $5,894 | $129,220 | $53,970 | $75,250 |
| 2021 | $5,895 | $129,220 | $53,970 | $75,250 |
| 2020 | $6,096 | $118,370 | $49,840 | $68,530 |
| 2019 | $6,001 | $118,370 | $49,840 | $68,530 |
| 2018 | $5,838 | $118,370 | $49,840 | $68,530 |
| 2017 | $5,656 | $118,370 | $49,840 | $68,530 |
| 2016 | $5,484 | $118,370 | $49,840 | $68,530 |
| 2015 | $5,474 | $134,540 | $53,270 | $81,270 |
| 2014 | $5,365 | $134,540 | $53,270 | $81,270 |
Source: Public Records
Map
Nearby Homes
- 50 Morris Ave
- 110 Fenwick St
- 50 Maltby Ave
- 690 Forest Rd Unit 702
- 690 Forest Rd Unit 703
- 690 Forest Rd Unit 761
- 690 Forest Rd Unit 501
- 690 Forest Rd Unit 651
- 34 Maltby Ave
- 148 Burwell Rd
- 249 Malcolm Rd
- 127 Rangely St
- 82 Hemlock St
- 56 Roger Rd
- 76 Westfield St
- 38 Chauncey St
- 21 Hinman St
- 2095 Chapel St
- 119 Westwood Rd
- 47 Dix St
- 78 Hillside St
- 66 Hillside St
- 60 Hillside St
- 84 Hillside St
- 41 Hillside St
- 81 Lakeview Ave
- 85 Lakeview Ave
- 75 Lakeview Ave
- 16 Lincoln Place
- 90 Hillside St
- 75 Hillside St
- 91 Lakeview Ave
- 61 Hillside St
- 6 Lincoln Place
- 57 Hillside St
- 95 Lakeview Ave
- 96 Hillside St
- 65 Lakeview Ave
- 46 Hillside St
- 101 Lakeview Ave
Your Personal Tour Guide
Ask me questions while you tour the home.