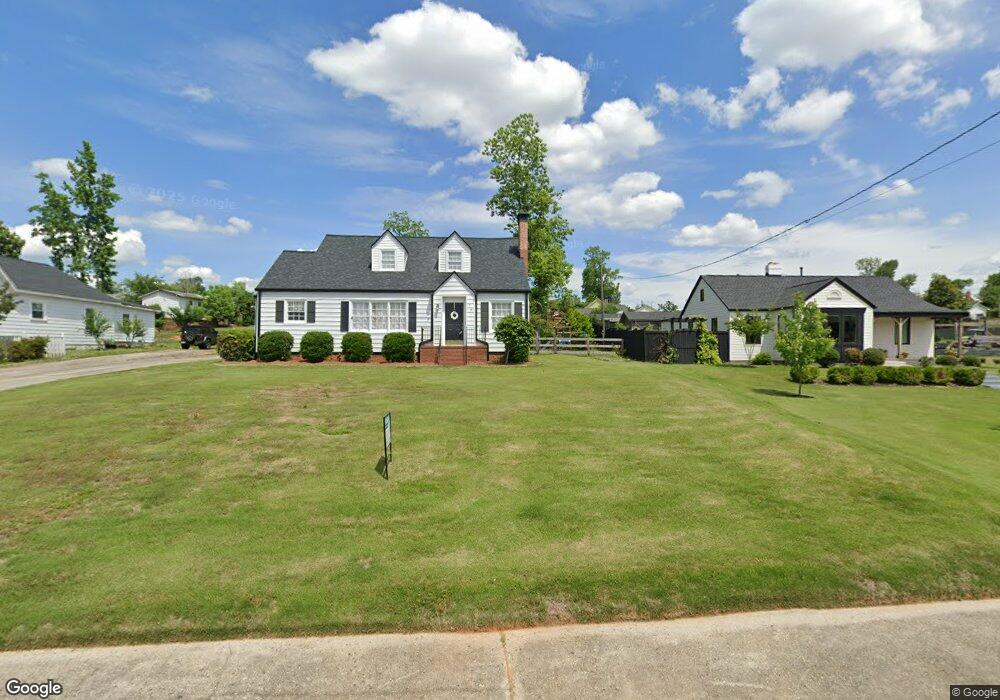
72 Hollis Heights Newnan, GA 30263
Estimated Value: $335,000 - $370,000
3
Beds
2
Baths
2,288
Sq Ft
$157/Sq Ft
Est. Value
About This Home
This home is located at 72 Hollis Heights, Newnan, GA 30263 and is currently estimated at $360,058, approximately $157 per square foot. 72 Hollis Heights is a home located in Coweta County with nearby schools including Atkinson Elementary School, Smokey Road Middle School, and Newnan High School.
Ownership History
Date
Name
Owned For
Owner Type
Purchase Details
Closed on
Oct 17, 2018
Sold by
Pike Janelle L
Bought by
Kraus Victoria
Current Estimated Value
Home Financials for this Owner
Home Financials are based on the most recent Mortgage that was taken out on this home.
Original Mortgage
$166,840
Outstanding Balance
$145,804
Interest Rate
4.6%
Mortgage Type
New Conventional
Estimated Equity
$214,254
Purchase Details
Closed on
Jan 19, 1999
Sold by
Pike Helen S
Bought by
Pike Janelle S
Home Financials for this Owner
Home Financials are based on the most recent Mortgage that was taken out on this home.
Original Mortgage
$95,600
Interest Rate
6.71%
Mortgage Type
New Conventional
Purchase Details
Closed on
Feb 29, 1996
Sold by
Pike Helen S
Bought by
Pike Helen S
Purchase Details
Closed on
Nov 30, 1989
Sold by
Pike Irvin
Bought by
Pike Helen S
Create a Home Valuation Report for This Property
The Home Valuation Report is an in-depth analysis detailing your home's value as well as a comparison with similar homes in the area
Home Values in the Area
Average Home Value in this Area
Purchase History
| Date | Buyer | Sale Price | Title Company |
|---|---|---|---|
| Kraus Victoria | $172,000 | -- | |
| Pike Janelle S | $90,600 | -- | |
| Pike Helen S | -- | -- | |
| Pike Helen S | -- | -- |
Source: Public Records
Mortgage History
| Date | Status | Borrower | Loan Amount |
|---|---|---|---|
| Open | Kraus Victoria | $166,840 | |
| Previous Owner | Pike Janelle S | $95,600 |
Source: Public Records
Tax History Compared to Growth
Tax History
| Year | Tax Paid | Tax Assessment Tax Assessment Total Assessment is a certain percentage of the fair market value that is determined by local assessors to be the total taxable value of land and additions on the property. | Land | Improvement |
|---|---|---|---|---|
| 2024 | $2,348 | $102,752 | $40,000 | $62,752 |
| 2023 | $2,348 | $86,353 | $39,000 | $47,353 |
| 2022 | $2,079 | $85,466 | $39,000 | $46,466 |
| 2021 | $2,045 | $76,106 | $39,000 | $37,106 |
| 2020 | $2,101 | $89,935 | $39,000 | $50,935 |
| 2019 | $2,067 | $69,066 | $10,238 | $58,828 |
| 2018 | $1,267 | $69,066 | $10,238 | $58,828 |
| 2017 | $1,057 | $62,364 | $10,237 | $52,127 |
| 2016 | $947 | $58,640 | $10,238 | $48,403 |
| 2015 | $611 | $47,471 | $10,238 | $37,233 |
| 2014 | $1,350 | $47,471 | $10,238 | $37,233 |
Source: Public Records
Map
Nearby Homes
- 25 5th St
- 17 Waverly Cir
- 157 Lagrange St
- 159 Lagrange St
- 12 Conner Dr
- 1 Newnan Views Cir
- 71 Spring St
- 131 Woodbine Cir
- 150 Spring St
- 42 W Washington St
- 168 Spring St
- 0 Highway 29 N Unit 14.41+/- AC 10432364
- 0 N Highway 29 Unit 20115352
- 138 Greenville St
- 97 W Washington St
- 12 Plantation Dr
- 20 Salbide Ave
- 33 Ray St
- 16 Hamilton Bohannon Dr
- 3 Center Ct
- 70 Hollis Heights
- 22 5th St
- 76 Hollis Heights
- 66 Hollis Heights
- 23 6th St
- 67 2nd Ave
- 20 5th St
- 71 Hollis Heights
- 73 Hollis Heights
- 69 Hollis Heights
- 71 2nd Ave
- 21 6th St
- 80 Hollis Heights
- 75 Hollis Heights
- 0 Waverly Cir Unit LOT 6D 3282555
- 0 Waverly Cir Unit LOT 6D
- 0 Waverly Cir Unit 20083284
- 0 Waverly Cir Unit LOT 6D 7435865
- 0 Waverly Cir Unit 8997430
- 0 Waverly Cir Unit 8761943