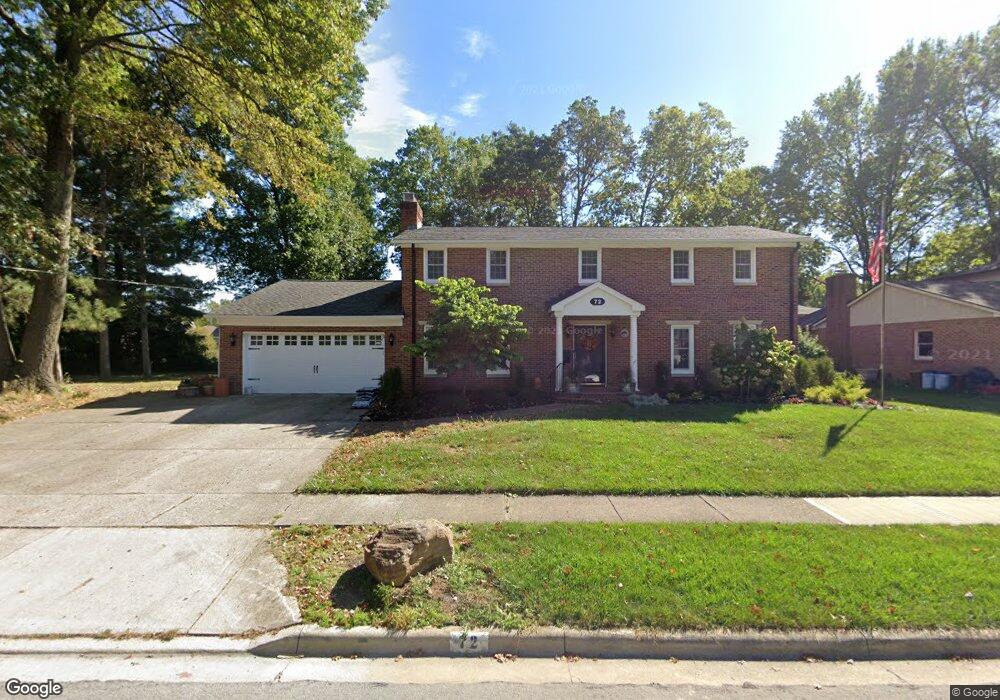
72 Kimothy Dr Westerville, OH 43081
Estimated Value: $480,000 - $559,000
4
Beds
3
Baths
2,772
Sq Ft
$182/Sq Ft
Est. Value
About This Home
This home is located at 72 Kimothy Dr, Westerville, OH 43081 and is currently estimated at $505,266, approximately $182 per square foot. 72 Kimothy Dr is a home located in Franklin County with nearby schools including Mark Twain Elementary School, Walnut Springs Middle School, and Westerville-North High School.
Ownership History
Date
Name
Owned For
Owner Type
Purchase Details
Closed on
May 1, 2023
Sold by
Biniker Chad E and Biniker Angela S
Bought by
Biniker Family Living Trust
Current Estimated Value
Purchase Details
Closed on
Jan 9, 2023
Sold by
Biniker Chad E and Biniker Angela S
Bought by
Biniker Family Living Trust and Biniker
Purchase Details
Closed on
Jul 28, 2017
Sold by
Hillcrest North Llc
Bought by
Cugini Capoccia Builders Inc
Purchase Details
Closed on
Jul 16, 2008
Sold by
Seith John D and Seith Joanne E
Bought by
Biniker Chad E and Biniker Angela S
Home Financials for this Owner
Home Financials are based on the most recent Mortgage that was taken out on this home.
Original Mortgage
$247,000
Interest Rate
6.15%
Mortgage Type
Purchase Money Mortgage
Purchase Details
Closed on
Sep 26, 2005
Sold by
Patterson M Dale and Patterson Anna Sue
Bought by
Hillcrest North Llc
Purchase Details
Closed on
Nov 2, 1988
Bought by
Seith John D and Seith Joanne E
Create a Home Valuation Report for This Property
The Home Valuation Report is an in-depth analysis detailing your home's value as well as a comparison with similar homes in the area
Home Values in the Area
Average Home Value in this Area
Purchase History
| Date | Buyer | Sale Price | Title Company |
|---|---|---|---|
| Biniker Family Living Trust | -- | None Listed On Document | |
| Biniker Family Living Trust | -- | None Listed On Document | |
| Cugini Capoccia Builders Inc | $68,000 | None Available | |
| Biniker Chad E | -- | Fati | |
| Hillcrest North Llc | $107,900 | Talon | |
| Seith John D | $140,000 | -- |
Source: Public Records
Mortgage History
| Date | Status | Borrower | Loan Amount |
|---|---|---|---|
| Previous Owner | Biniker Chad E | $247,000 |
Source: Public Records
Tax History
| Year | Tax Paid | Tax Assessment Tax Assessment Total Assessment is a certain percentage of the fair market value that is determined by local assessors to be the total taxable value of land and additions on the property. | Land | Improvement |
|---|---|---|---|---|
| 2025 | $8,493 | $143,400 | $33,250 | $110,150 |
| 2024 | $8,493 | $143,400 | $33,250 | $110,150 |
| 2023 | $7,977 | $143,400 | $33,250 | $110,150 |
| 2022 | $7,905 | $108,500 | $18,410 | $90,090 |
| 2021 | $7,971 | $108,500 | $18,410 | $90,090 |
| 2020 | $8,849 | $120,790 | $18,410 | $102,380 |
| 2019 | $7,157 | $92,230 | $18,410 | $73,820 |
| 2018 | $6,879 | $92,230 | $18,410 | $73,820 |
| 2017 | $7,000 | $92,230 | $18,410 | $73,820 |
| 2016 | $6,960 | $83,020 | $18,200 | $64,820 |
| 2015 | $6,741 | $83,020 | $18,200 | $64,820 |
| 2014 | $6,746 | $83,020 | $18,200 | $64,820 |
| 2013 | $3,208 | $79,065 | $17,325 | $61,740 |
Source: Public Records
Map
Nearby Homes
- 687 E College Ave
- 629 Andrew Ave
- 138 Wood St
- 961 E College Ave
- 852 Karen Ct
- 215 Mainsail Dr
- 328 Myrtle Dr Unit Lot 5
- 348 Myrtle Dr Unit Lot 10
- 337 Myrtle Dr Unit Lot 2
- 334 Myrtle Dr Unit Lot 7
- 342 Myrtle Dr Unit Lot 8
- 344 Myrtle Dr Unit Lot 9
- 655 Mohican Way
- 487 Beachside Dr
- 960 Lakeland Dr
- 133 Illinois Ave
- 339 Aylesbury Dr S
- 392 Hickory Ln
- 303 Pointe Place
- 291 Pointe Place
Your Personal Tour Guide
Ask me questions while you tour the home.