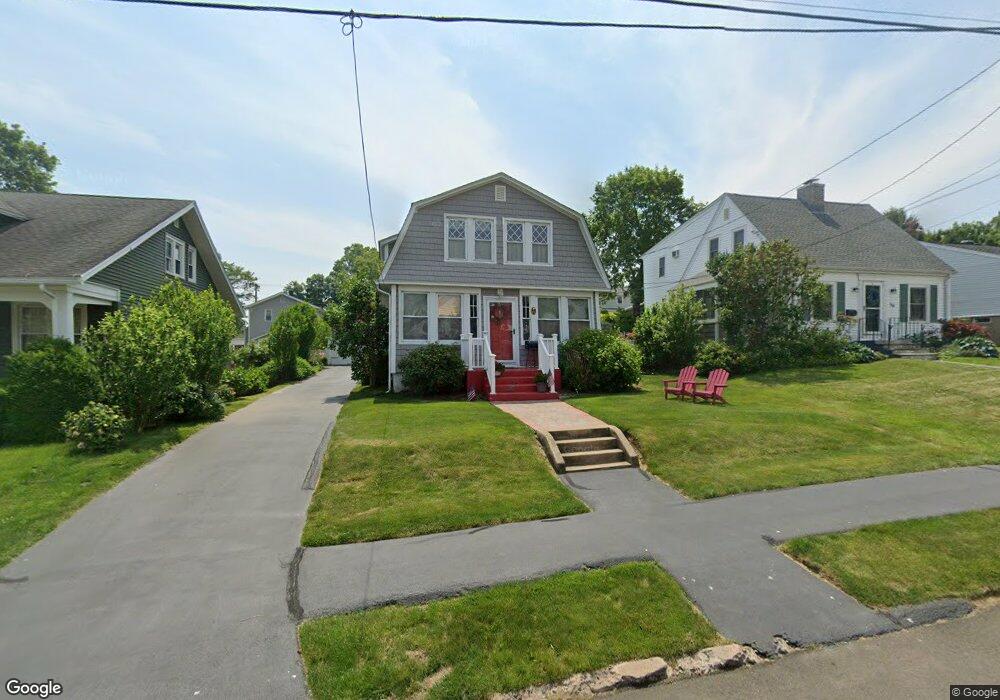
72 Lake St West Haven, CT 06516
West Shore NeighborhoodEstimated Value: $418,000 - $447,000
3
Beds
2
Baths
1,418
Sq Ft
$305/Sq Ft
Est. Value
About This Home
This home is located at 72 Lake St, West Haven, CT 06516 and is currently estimated at $432,575, approximately $305 per square foot. 72 Lake St is a home located in New Haven County with nearby schools including Carrigan 5/6 Intermediate School, Harry M. Bailey Middle School, and West Haven High School.
Ownership History
Date
Name
Owned For
Owner Type
Purchase Details
Closed on
Nov 1, 2006
Sold by
Schwab-Wardell Kathleen A and Wardell David J
Bought by
Peddle Geraldine A
Current Estimated Value
Home Financials for this Owner
Home Financials are based on the most recent Mortgage that was taken out on this home.
Original Mortgage
$120,000
Interest Rate
6.47%
Mortgage Type
Purchase Money Mortgage
Create a Home Valuation Report for This Property
The Home Valuation Report is an in-depth analysis detailing your home's value as well as a comparison with similar homes in the area
Home Values in the Area
Average Home Value in this Area
Purchase History
| Date | Buyer | Sale Price | Title Company |
|---|---|---|---|
| Peddle Geraldine A | $325,000 | -- | |
| Peddle Geraldine A | $325,000 | -- |
Source: Public Records
Mortgage History
| Date | Status | Borrower | Loan Amount |
|---|---|---|---|
| Open | Peddle Geraldine A | $140,000 | |
| Closed | Peddle Geraldine A | $120,000 |
Source: Public Records
Tax History Compared to Growth
Tax History
| Year | Tax Paid | Tax Assessment Tax Assessment Total Assessment is a certain percentage of the fair market value that is determined by local assessors to be the total taxable value of land and additions on the property. | Land | Improvement |
|---|---|---|---|---|
| 2025 | $8,161 | $248,290 | $88,900 | $159,390 |
| 2024 | $7,315 | $156,100 | $61,530 | $94,570 |
| 2023 | $7,040 | $156,100 | $61,530 | $94,570 |
| 2022 | $6,914 | $156,100 | $61,530 | $94,570 |
| 2021 | $6,914 | $156,100 | $61,530 | $94,570 |
| 2020 | $6,802 | $139,930 | $56,280 | $83,650 |
| 2019 | $6,585 | $139,930 | $56,280 | $83,650 |
| 2018 | $6,491 | $139,930 | $56,280 | $83,650 |
| 2017 | $6,316 | $139,930 | $56,280 | $83,650 |
| 2016 | $6,246 | $139,930 | $56,280 | $83,650 |
| 2015 | $6,267 | $157,150 | $64,820 | $92,330 |
| 2014 | $6,267 | $157,150 | $64,820 | $92,330 |
Source: Public Records
Map
Nearby Homes