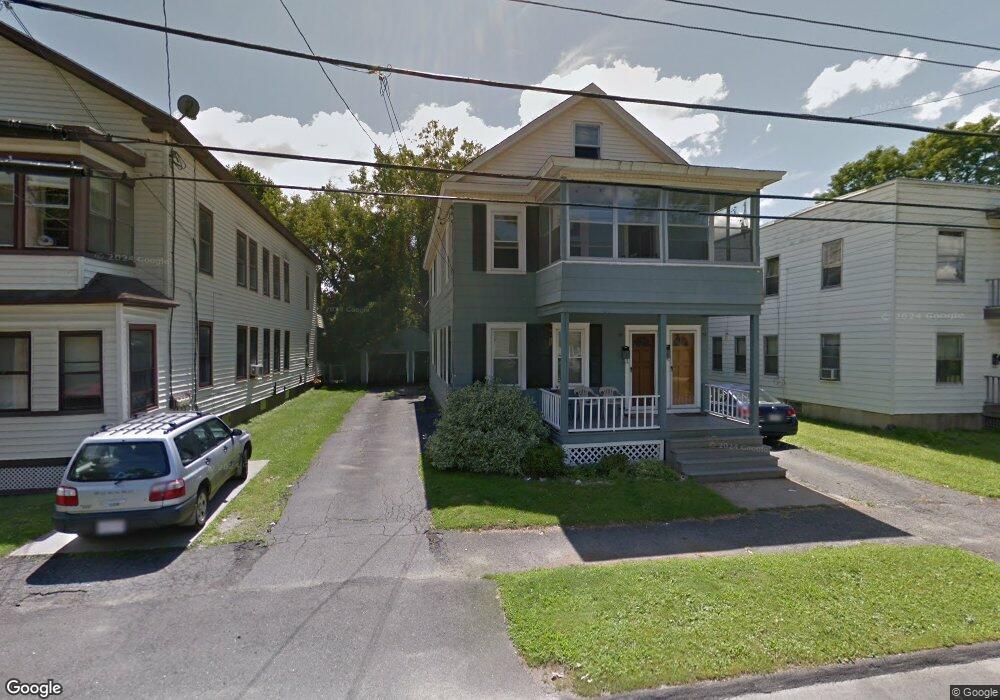
72 Lyman St Pittsfield, MA 01201
Estimated Value: $210,000 - $248,000
4
Beds
2
Baths
1,886
Sq Ft
$123/Sq Ft
Est. Value
About This Home
This home is located at 72 Lyman St, Pittsfield, MA 01201 and is currently estimated at $232,614, approximately $123 per square foot. 72 Lyman St is a home located in Berkshire County with nearby schools including Egremont Elementary School, Theodore Herberg Middle School, and Pittsfield High School.
Ownership History
Date
Name
Owned For
Owner Type
Purchase Details
Closed on
Jan 18, 2013
Sold by
Choquette James W and Choquette Ashley S
Bought by
Choquette Ashley S
Current Estimated Value
Home Financials for this Owner
Home Financials are based on the most recent Mortgage that was taken out on this home.
Original Mortgage
$119,000
Outstanding Balance
$82,525
Interest Rate
3.39%
Mortgage Type
New Conventional
Estimated Equity
$150,089
Purchase Details
Closed on
Jul 1, 2005
Sold by
Romano Stephen M
Bought by
Losaw Ashley S and Choquette James W
Home Financials for this Owner
Home Financials are based on the most recent Mortgage that was taken out on this home.
Original Mortgage
$129,980
Interest Rate
5.73%
Mortgage Type
Purchase Money Mortgage
Create a Home Valuation Report for This Property
The Home Valuation Report is an in-depth analysis detailing your home's value as well as a comparison with similar homes in the area
Home Values in the Area
Average Home Value in this Area
Purchase History
| Date | Buyer | Sale Price | Title Company |
|---|---|---|---|
| Choquette Ashley S | -- | -- | |
| Choquette Ashley S | -- | -- | |
| Choquette Ashley S | -- | -- | |
| Losaw Ashley S | $134,000 | -- | |
| Losaw Ashley S | $134,000 | -- | |
| Losaw Ashley S | $134,000 | -- |
Source: Public Records
Mortgage History
| Date | Status | Borrower | Loan Amount |
|---|---|---|---|
| Open | Choquette Ashley S | $119,000 | |
| Closed | Losaw Ashley S | $119,000 | |
| Previous Owner | Losaw Ashley S | $129,980 | |
| Previous Owner | Losaw Ashley S | $94,400 |
Source: Public Records
Tax History Compared to Growth
Tax History
| Year | Tax Paid | Tax Assessment Tax Assessment Total Assessment is a certain percentage of the fair market value that is determined by local assessors to be the total taxable value of land and additions on the property. | Land | Improvement |
|---|---|---|---|---|
| 2025 | $3,502 | $195,200 | $54,000 | $141,200 |
| 2024 | $3,387 | $183,600 | $54,000 | $129,600 |
| 2023 | $3,158 | $172,400 | $54,000 | $118,400 |
| 2022 | $3,100 | $167,000 | $54,000 | $113,000 |
| 2021 | $2,868 | $149,000 | $54,000 | $95,000 |
| 2020 | $2,734 | $138,700 | $46,800 | $91,900 |
| 2019 | $2,561 | $131,900 | $43,200 | $88,700 |
| 2018 | $2,527 | $127,900 | $43,200 | $84,700 |
| 2017 | $2,505 | $127,600 | $45,000 | $82,600 |
| 2016 | $2,418 | $128,900 | $45,000 | $83,900 |
| 2015 | $2,328 | $128,900 | $45,000 | $83,900 |
Source: Public Records
Map
Nearby Homes
- 25 Ashley St
- 129 Newell St
- 26 Crosier Ave
- 762 East St
- 168 Elm St
- 63 Reuter Ave
- 38 Northumberland Rd
- 500 Fenn St
- 81 Northumberland Rd
- 66 Holmes Rd
- 36 Chickering St
- 25 Putnam Ave
- 51 Foote Ave
- 22 Copley Terrace
- 100 Northumberland Rd
- 48 Copley Terrace
- 235 Dawes Ave
- 206 Dawes Ave
- 16 Revere Pkwy
- 104 Appleton Ave