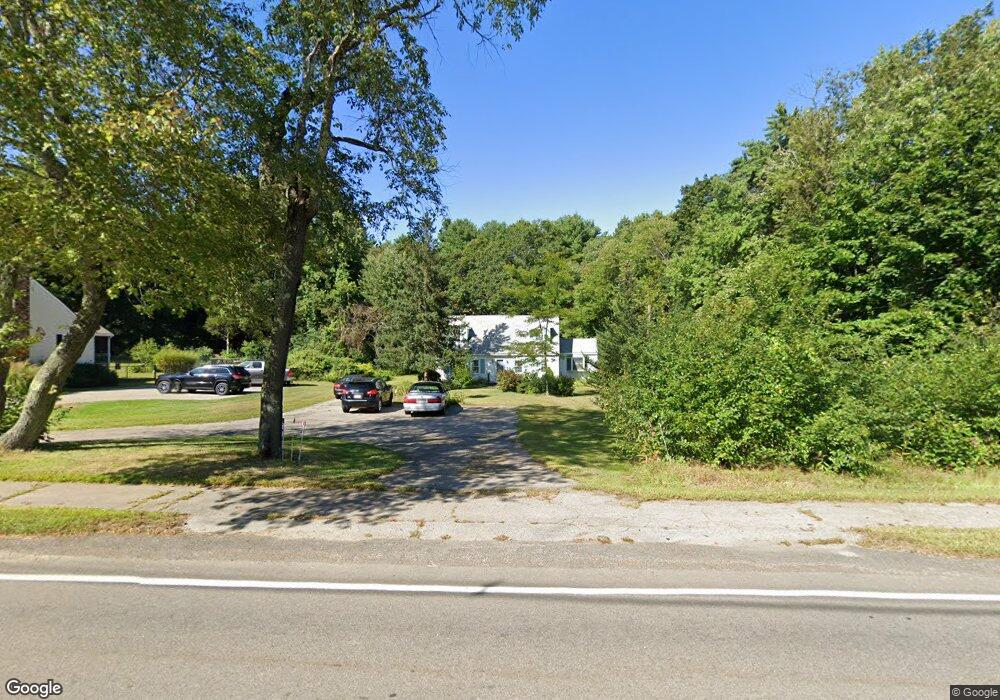
72 Main St Norfolk, MA 02056
Estimated Value: $566,398 - $719,000
4
Beds
2
Baths
1,806
Sq Ft
$373/Sq Ft
Est. Value
About This Home
This home is located at 72 Main St, Norfolk, MA 02056 and is currently estimated at $673,600, approximately $372 per square foot. 72 Main St is a home located in Norfolk County with nearby schools including H. Olive Day School, Freeman-Kennedy School, and Woodside Montessori Academy.
Ownership History
Date
Name
Owned For
Owner Type
Purchase Details
Closed on
Oct 8, 2019
Sold by
Crane William R and Crane Suzanne M
Bought by
Crane Lt
Current Estimated Value
Purchase Details
Closed on
Dec 4, 1995
Sold by
Sullivan Jayne
Bought by
Crane William R and Crane Suzanne M
Create a Home Valuation Report for This Property
The Home Valuation Report is an in-depth analysis detailing your home's value as well as a comparison with similar homes in the area
Home Values in the Area
Average Home Value in this Area
Purchase History
| Date | Buyer | Sale Price | Title Company |
|---|---|---|---|
| Crane Lt | -- | -- | |
| Crane William R | $4,000 | -- |
Source: Public Records
Mortgage History
| Date | Status | Borrower | Loan Amount |
|---|---|---|---|
| Previous Owner | Crane William R | $111,000 | |
| Previous Owner | Crane William R | $50,000 | |
| Previous Owner | Crane William R | $100,000 |
Source: Public Records
Tax History Compared to Growth
Tax History
| Year | Tax Paid | Tax Assessment Tax Assessment Total Assessment is a certain percentage of the fair market value that is determined by local assessors to be the total taxable value of land and additions on the property. | Land | Improvement |
|---|---|---|---|---|
| 2025 | $7,289 | $456,400 | $228,800 | $227,600 |
| 2024 | $7,144 | $458,800 | $242,000 | $216,800 |
| 2023 | $6,730 | $410,100 | $231,200 | $178,900 |
| 2022 | $6,685 | $367,300 | $214,200 | $153,100 |
| 2021 | $6,057 | $336,700 | $188,200 | $148,500 |
| 2020 | $5,611 | $301,000 | $178,800 | $122,200 |
| 2019 | $5,589 | $305,600 | $178,800 | $126,800 |
| 2018 | $5,210 | $279,800 | $164,600 | $115,200 |
| 2017 | $5,134 | $281,800 | $164,600 | $117,200 |
| 2016 | $5,003 | $276,700 | $161,000 | $115,700 |
| 2015 | $4,655 | $263,600 | $153,400 | $110,200 |
| 2014 | $4,626 | $265,400 | $153,400 | $112,000 |
Source: Public Records
Map
Nearby Homes
- 8 Boyde's Crossing
- 8 Boyde's Crossing Unit 4
- 118 Main St
- 3 Elliot Mills Unit 3
- 6 Elliot Mills Unit 6
- 7 Malcolm St
- 45 Meetinghouse Rd Unit 45
- 12 Brookside Ln
- 10 Medway St
- 37 Thomas Mann Cir Unit 23
- 27 Thomas Mann Cir Unit 18
- 51 Thomas Mann Unit 30
- 28 Thomas Mann Cir Unit Lot 38
- 53 Thomas Mann Cir Unit 31
- 57 Thomas Mann Cir Unit 57
- 63 Thomas Mann Cir Unit 36
- 7 Keeney Pond Rd
- 16 Keeney Pond Rd
- The Georgetown L Plan at Lakeland Hills
- The Georgetown Grand L Plan at Lakeland Hills