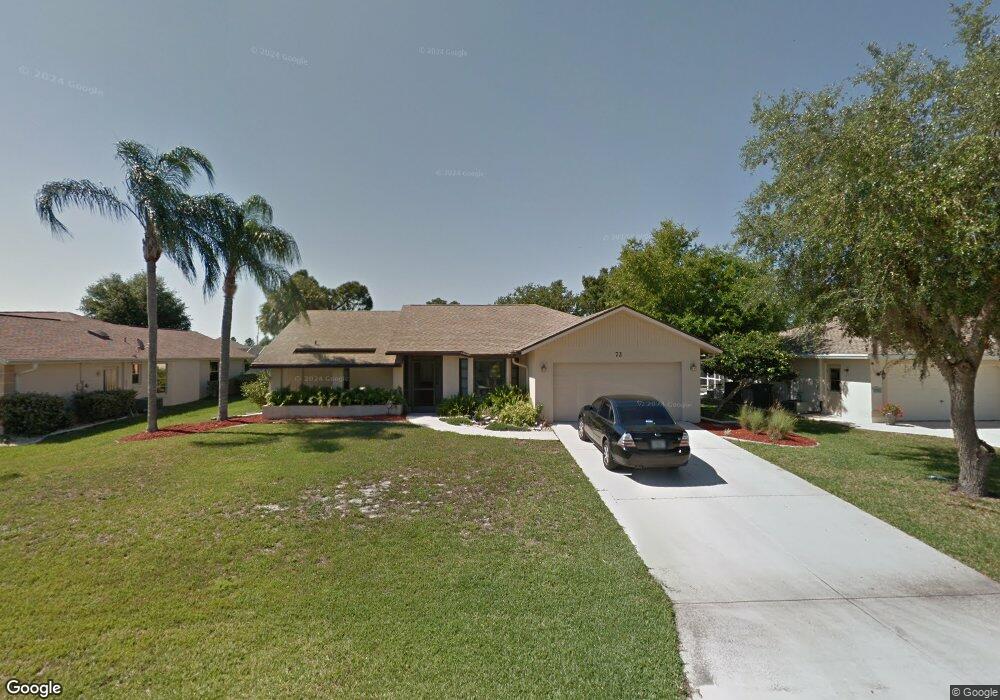
72 Manizaks Ave Punta Gorda, FL 33983
Deep Creek NeighborhoodEstimated Value: $318,378 - $366,000
3
Beds
2
Baths
1,776
Sq Ft
$194/Sq Ft
Est. Value
About This Home
This home is located at 72 Manizaks Ave, Punta Gorda, FL 33983 and is currently estimated at $344,345, approximately $193 per square foot. 72 Manizaks Ave is a home located in Charlotte County with nearby schools including Deep Creek Elementary School, Punta Gorda Middle School, and Charlotte High School.
Ownership History
Date
Name
Owned For
Owner Type
Purchase Details
Closed on
Jun 27, 2003
Sold by
Palanza Christy E
Bought by
Lloyd Harold R and Lloyd Katherine R
Current Estimated Value
Home Financials for this Owner
Home Financials are based on the most recent Mortgage that was taken out on this home.
Original Mortgage
$127,920
Outstanding Balance
$54,549
Interest Rate
5.3%
Mortgage Type
Purchase Money Mortgage
Estimated Equity
$289,796
Purchase Details
Closed on
Jan 23, 2003
Sold by
Palanza Monica R
Bought by
Palanza Christy E
Purchase Details
Closed on
Feb 29, 2000
Sold by
Potter Anthony P and Potter Crystal D
Bought by
Palanza Christy E and Palanza Monica R
Home Financials for this Owner
Home Financials are based on the most recent Mortgage that was taken out on this home.
Original Mortgage
$100,800
Interest Rate
8.29%
Purchase Details
Closed on
Dec 7, 1994
Sold by
Wolsfeld Robert F and Wolsfeld Marjorie A
Bought by
Potter Crystal Davis and Potter Anthony P
Create a Home Valuation Report for This Property
The Home Valuation Report is an in-depth analysis detailing your home's value as well as a comparison with similar homes in the area
Home Values in the Area
Average Home Value in this Area
Purchase History
| Date | Buyer | Sale Price | Title Company |
|---|---|---|---|
| Lloyd Harold R | $159,900 | -- | |
| Palanza Christy E | -- | -- | |
| Palanza Christy E | $112,000 | -- | |
| Potter Crystal Davis | $103,500 | -- |
Source: Public Records
Mortgage History
| Date | Status | Borrower | Loan Amount |
|---|---|---|---|
| Open | Lloyd Harold R | $127,920 | |
| Previous Owner | Palanza Christy E | $100,800 |
Source: Public Records
Tax History Compared to Growth
Tax History
| Year | Tax Paid | Tax Assessment Tax Assessment Total Assessment is a certain percentage of the fair market value that is determined by local assessors to be the total taxable value of land and additions on the property. | Land | Improvement |
|---|---|---|---|---|
| 2024 | $3,554 | $216,230 | -- | -- |
| 2023 | $3,554 | $209,932 | $0 | $0 |
| 2022 | $3,317 | $203,817 | $0 | $0 |
| 2021 | $3,315 | $197,881 | $17,000 | $180,881 |
| 2020 | $3,619 | $177,252 | $13,600 | $163,652 |
| 2019 | $3,481 | $170,655 | $13,600 | $157,055 |
| 2018 | $3,212 | $168,407 | $11,050 | $157,357 |
| 2017 | $3,080 | $164,593 | $10,625 | $153,968 |
| 2016 | $2,832 | $134,971 | $0 | $0 |
| 2015 | $2,658 | $122,701 | $0 | $0 |
| 2014 | $2,302 | $111,546 | $0 | $0 |
Source: Public Records
Map
Nearby Homes
- 41 Manizaks Ave
- 21 Manizaks Ave
- 25504 Taltal Dr
- 41 Rio Cuarto St
- 80 Rio Cuarto St
- 25434 Colon Dr
- 25433 Colon Dr
- 26058 Paysandu Dr
- 49 Marajo St
- 25348 Aysen Dr
- 26071 Paysandu Dr
- 25730 Deep Creek Blvd
- 25688 Deep Creek Blvd
- 30 Santarem Cir
- 25655 Deep Creek Blvd
- 222 Santarem Cir
- 51 Lima St
- 98 Valdiva St
- 25214 Aysen Dr
- 141 Angol St
- 64 Manizaks Ave
- 80 Manizaks Ave
- 86 Santarem Cir
- 56 Manizaks Ave
- 73 Manizaks Ave
- 90 Santarem Cir
- 80 Santarem Cir
- 65 Manizaks Ave
- 81 Manizaks Ave
- 57 Manizaks Ave
- 89 Manizaks Ave
- 94 Santarem Cir
- 93 Manizaks Ave
- 49 Manizaks Ave
- 40 Manizaks Ave
- 98 Santarem Cir
- 103 Manizaks Ave
- 109 Manizaks Ave
- 121 Manizaks Ave
- 49 Rio Cuarto St