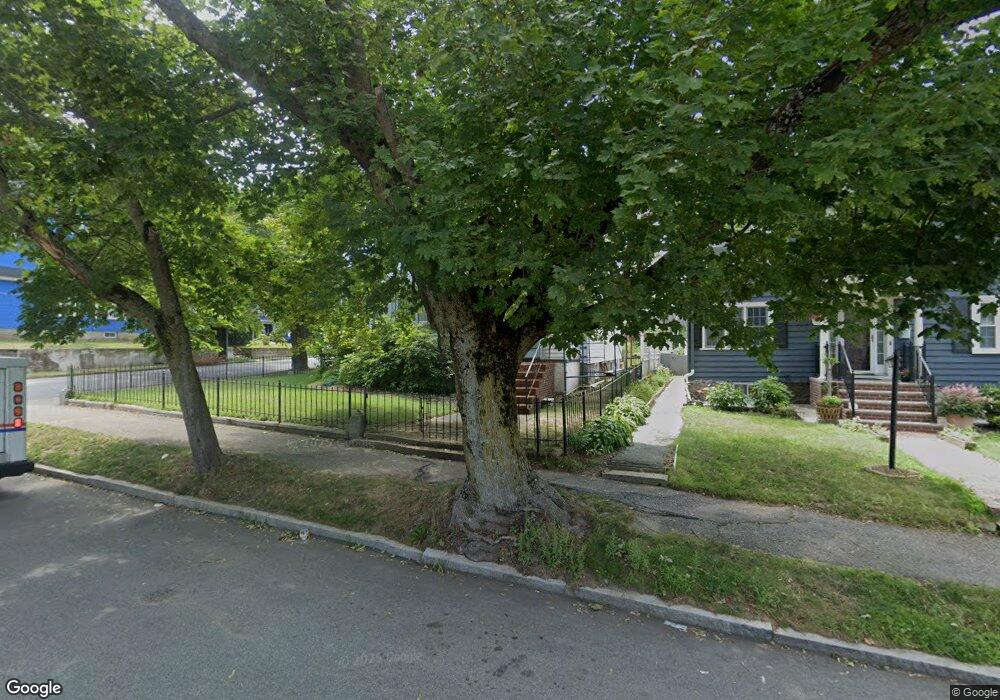
72 Margin St Peabody, MA 01960
Peabody Town Center NeighborhoodEstimated Value: $637,000 - $718,000
3
Beds
2
Baths
1,473
Sq Ft
$457/Sq Ft
Est. Value
About This Home
This home is located at 72 Margin St, Peabody, MA 01960 and is currently estimated at $673,792, approximately $457 per square foot. 72 Margin St is a home located in Essex County with nearby schools including Peabody Veterans Memorial High School, St John The Baptist School, and The Phoenix School.
Ownership History
Date
Name
Owned For
Owner Type
Purchase Details
Closed on
Jan 21, 2010
Sold by
Wheeler Krista and Springer Krista
Bought by
Booth Jamie E and Booth Rebecca L
Current Estimated Value
Home Financials for this Owner
Home Financials are based on the most recent Mortgage that was taken out on this home.
Original Mortgage
$229,460
Outstanding Balance
$149,426
Interest Rate
4.79%
Mortgage Type
Purchase Money Mortgage
Estimated Equity
$524,366
Purchase Details
Closed on
Sep 30, 2004
Sold by
Lilley John E and Lilley Tricia M
Bought by
Springer Krista
Home Financials for this Owner
Home Financials are based on the most recent Mortgage that was taken out on this home.
Original Mortgage
$305,460
Interest Rate
5.81%
Mortgage Type
Purchase Money Mortgage
Create a Home Valuation Report for This Property
The Home Valuation Report is an in-depth analysis detailing your home's value as well as a comparison with similar homes in the area
Home Values in the Area
Average Home Value in this Area
Purchase History
| Date | Buyer | Sale Price | Title Company |
|---|---|---|---|
| Booth Jamie E | $298,000 | -- | |
| Springer Krista | $340,000 | -- |
Source: Public Records
Mortgage History
| Date | Status | Borrower | Loan Amount |
|---|---|---|---|
| Open | Springer Krista | $229,460 | |
| Closed | Springer Krista | $59,600 | |
| Previous Owner | Springer Krista | $305,460 |
Source: Public Records
Tax History
| Year | Tax Paid | Tax Assessment Tax Assessment Total Assessment is a certain percentage of the fair market value that is determined by local assessors to be the total taxable value of land and additions on the property. | Land | Improvement |
|---|---|---|---|---|
| 2025 | $5,452 | $588,800 | $206,600 | $382,200 |
| 2024 | $5,079 | $556,900 | $206,600 | $350,300 |
| 2023 | $5,125 | $538,300 | $184,400 | $353,900 |
| 2022 | $4,783 | $473,600 | $164,700 | $308,900 |
| 2021 | $4,723 | $450,200 | $149,700 | $300,500 |
| 2020 | $4,541 | $422,800 | $149,700 | $273,100 |
| 2019 | $4,223 | $383,600 | $149,700 | $233,900 |
| 2018 | $4,202 | $366,700 | $136,100 | $230,600 |
| 2017 | $3,880 | $329,900 | $136,100 | $193,800 |
| 2016 | $3,844 | $322,500 | $136,100 | $186,400 |
| 2015 | $3,707 | $301,400 | $132,700 | $168,700 |
Source: Public Records
Map
Nearby Homes
- 41 Northend St
- 30 Driscoll St
- 9 Highland St
- 11 A Endicott St Unit 3
- 16 Tremont St
- 16 Oakland St
- 0 Buttonwood Ln Unit 2
- 28 Sabino Farm Rd
- 46 Walnut St
- 76 Water St
- 75 Walnut St Unit 315
- 6 Mcdewell Ave Unit 4
- 8 Crowninshield St Unit 410
- 10 Crowninshield St Unit 303
- 12 Adams Ave
- 44 Orne St Unit 44
- 21 Manning St
- 40 Buffum St Unit 2
- 40 Buffum St Unit 1
- 10 Park St
Your Personal Tour Guide
Ask me questions while you tour the home.