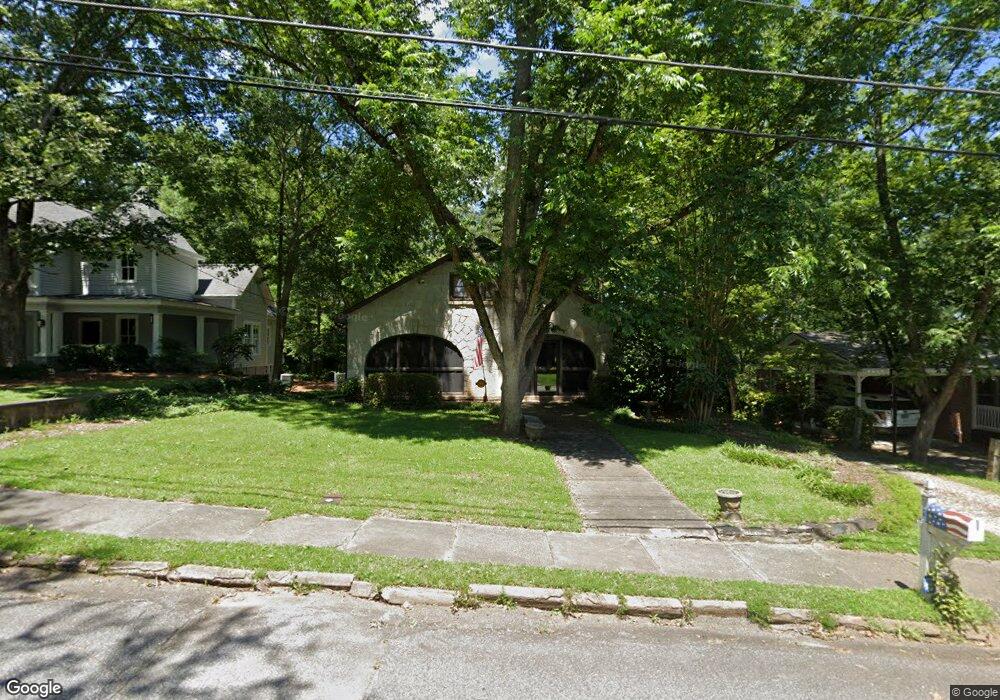
72 Martin St Jefferson, GA 30549
Estimated Value: $449,000 - $641,000
3
Beds
4
Baths
3,612
Sq Ft
$148/Sq Ft
Est. Value
About This Home
This home is located at 72 Martin St, Jefferson, GA 30549 and is currently estimated at $534,839, approximately $148 per square foot. 72 Martin St is a home located in Jackson County with nearby schools including Jefferson Elementary School, Jefferson Academy, and Jefferson Middle School.
Ownership History
Date
Name
Owned For
Owner Type
Purchase Details
Closed on
Feb 9, 2024
Sold by
Arnold Christopher L
Bought by
Arnold Christopher and Arnold Sherry
Current Estimated Value
Purchase Details
Closed on
Sep 30, 2005
Sold by
Hix Steven D
Bought by
Arnold Christopher Lee and Arnold Sherry H
Home Financials for this Owner
Home Financials are based on the most recent Mortgage that was taken out on this home.
Original Mortgage
$155,352
Interest Rate
5.66%
Mortgage Type
New Conventional
Create a Home Valuation Report for This Property
The Home Valuation Report is an in-depth analysis detailing your home's value as well as a comparison with similar homes in the area
Home Values in the Area
Average Home Value in this Area
Purchase History
| Date | Buyer | Sale Price | Title Company |
|---|---|---|---|
| Arnold Christopher | -- | -- | |
| Arnold Christopher Lee | $155,000 | -- |
Source: Public Records
Mortgage History
| Date | Status | Borrower | Loan Amount |
|---|---|---|---|
| Previous Owner | Arnold Christopher Lee | $155,352 |
Source: Public Records
Tax History Compared to Growth
Tax History
| Year | Tax Paid | Tax Assessment Tax Assessment Total Assessment is a certain percentage of the fair market value that is determined by local assessors to be the total taxable value of land and additions on the property. | Land | Improvement |
|---|---|---|---|---|
| 2024 | $2,794 | $101,880 | $7,640 | $94,240 |
| 2023 | $2,794 | $90,640 | $7,640 | $83,000 |
| 2022 | $2,288 | $71,760 | $6,880 | $64,880 |
| 2021 | $2,330 | $71,760 | $6,880 | $64,880 |
| 2020 | $2,066 | $59,560 | $6,880 | $52,680 |
| 2019 | $2,097 | $59,560 | $6,880 | $52,680 |
| 2018 | $2,018 | $56,920 | $6,880 | $50,040 |
| 2017 | $1,893 | $52,349 | $6,899 | $45,450 |
| 2016 | $1,902 | $52,349 | $6,899 | $45,450 |
| 2015 | $1,909 | $52,349 | $6,899 | $45,450 |
| 2014 | $1,841 | $50,009 | $6,899 | $43,110 |
| 2013 | -- | $50,009 | $6,899 | $43,110 |
Source: Public Records
Map
Nearby Homes
- 107 Church St
- 0 Georgia 82 N
- 0 Curry Dr Unit LOT 30
- 0 Curry Dr Unit 7665673
- 0 Curry Dr Unit 7666260
- 0 Curry Dr Unit LOT 6
- 0 Curry Dr Unit LOT 14
- 0 Curry Dr Unit LOT 32
- 0 Curry Dr Unit 7665753
- 0 Curry Dr Unit LOT 31
- 0 Curry Dr Unit 7666653
- 0 Curry Dr Unit LOT 13
- 0 Curry Dr Unit LOT 36
- 0 Curry Dr Unit LOT 35
- 0 Curry Dr Unit 7665736
- 0 Curry Dr Unit 7666371
- 0 Curry Dr Unit LOT 29
- 0 Curry Dr Unit 7665727
- 0 Curry Dr Unit LOT 34
- 0 Curry Dr Unit LOT 33