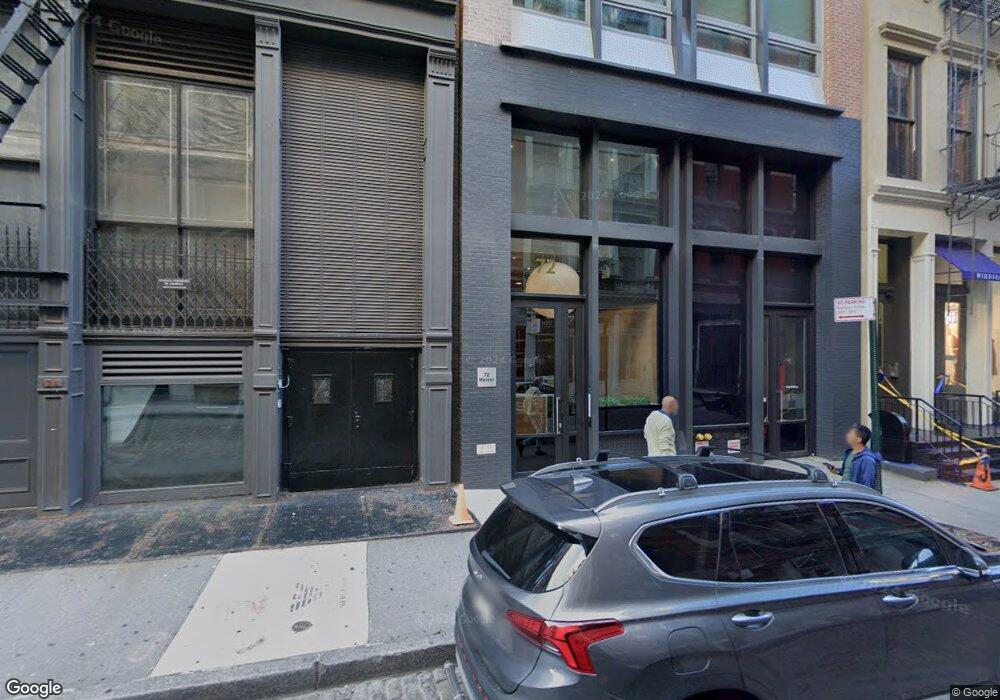
72 Mercer St Unit COM New York, NY 10012
SoHo NeighborhoodEstimated Value: $5,026,000 - $21,929,349
--
Bed
--
Bath
13,666
Sq Ft
$986/Sq Ft
Est. Value
About This Home
This home is located at 72 Mercer St Unit COM, New York, NY 10012 and is currently estimated at $13,477,675, approximately $986 per square foot. 72 Mercer St Unit COM is a home located in New York County with nearby schools including P.S. 130 - Hernando De Soto, Middle School 297, and Clinton School.
Ownership History
Date
Name
Owned For
Owner Type
Purchase Details
Closed on
Dec 7, 2021
Sold by
Vno 501 Broadway Llc
Bought by
501 Broadway Cp Llc
Current Estimated Value
Home Financials for this Owner
Home Financials are based on the most recent Mortgage that was taken out on this home.
Original Mortgage
$19,250,000
Outstanding Balance
$17,700,202
Interest Rate
3.09%
Mortgage Type
Purchase Money Mortgage
Estimated Equity
-$4,222,527
Purchase Details
Closed on
Aug 20, 2012
Sold by
501 Broadway Llc
Bought by
Vno 501 Broadway Llc
Home Financials for this Owner
Home Financials are based on the most recent Mortgage that was taken out on this home.
Original Mortgage
$10,760,325
Interest Rate
3.61%
Mortgage Type
Purchase Money Mortgage
Purchase Details
Closed on
Nov 28, 2007
Sold by
501 Broadway Partners Llc
Bought by
501 Broadway Llc
Create a Home Valuation Report for This Property
The Home Valuation Report is an in-depth analysis detailing your home's value as well as a comparison with similar homes in the area
Home Values in the Area
Average Home Value in this Area
Purchase History
| Date | Buyer | Sale Price | Title Company |
|---|---|---|---|
| 501 Broadway Cp Llc | $27,500,000 | -- | |
| Vno 501 Broadway Llc | $31,000,000 | -- | |
| 501 Broadway Llc | -- | -- |
Source: Public Records
Mortgage History
| Date | Status | Borrower | Loan Amount |
|---|---|---|---|
| Open | 501 Broadway Cp Llc | $19,250,000 | |
| Previous Owner | Vno 501 Broadway Llc | $10,760,325 |
Source: Public Records
Tax History Compared to Growth
Tax History
| Year | Tax Paid | Tax Assessment Tax Assessment Total Assessment is a certain percentage of the fair market value that is determined by local assessors to be the total taxable value of land and additions on the property. | Land | Improvement |
|---|---|---|---|---|
| 2025 | $178,442 | $1,541,492 | $31,343 | $1,510,149 |
| 2024 | $178,442 | $1,427,307 | $116,839 | $1,392,855 |
| 2023 | $162,118 | $1,321,581 | $38,280 | $1,283,301 |
| 2022 | $149,718 | $4,369,950 | $116,839 | $4,253,111 |
| 2021 | $150,109 | $4,958,550 | $116,839 | $4,841,711 |
| 2020 | $147,900 | $4,814,100 | $116,839 | $4,697,261 |
| 2019 | $138,471 | $4,011,660 | $116,839 | $3,894,821 |
| 2018 | $111,234 | $1,016,601 | $35,530 | $981,071 |
| 2017 | $100,560 | $941,298 | $37,450 | $903,848 |
| 2016 | $82,503 | $941,294 | $41,270 | $900,024 |
| 2015 | $18,448 | $912,126 | $38,253 | $873,873 |
| 2014 | $18,448 | $844,562 | $29,509 | $815,053 |
Source: Public Records
Map
Nearby Homes
- 72 Mercer St Unit 5W
- 48 Mercer St Unit 6
- 46 Mercer St Unit 4-W
- 54 Greene St Unit 3A
- 515 Broadway Unit 4
- 56 Crosby St Unit 3R
- 508 Broadway Unit 4
- 508 Broadway Unit BUILDING
- 508 Broadway Unit 5
- 508 Broadway Unit 4/5
- 519 Broadway Unit PHC
- 519 Broadway Unit 2
- 519 Broadway
- 510 Broadway Unit 5
- 63 Greene St Unit 4DLOFT
- 63 Greene St Unit 2E
- 63 Greene St Unit PHA
- 106 Spring St Unit 3S
- 41 Greene St Unit 5
- 40 Mercer St Unit 7
- 72 Mercer St Unit PHW
- 72 Mercer St Unit PHE
- 72 Mercer St Unit 4E
- 72 Mercer St Unit 4W
- 72 Mercer St Unit 3E
- 72 Mercer St Unit 3W
- 72 Mercer St Unit 2E
- 72 Mercer St
- 72 Mercer St Unit 4 WEST
- 72 Mercer St Unit 2 WEST
- 72 Mercer St Unit PHW/5W
- 72 Mercer St Unit 3EAST
- 499 Broadway Unit 3
- 499 Broadway Unit 3NEW
- 499 Broadway
- 499 Broadway Unit 3 FL
- 495 Broadway
- 70 Mercer St Unit PH
- 70 Mercer St Unit 2
- 511 Broadway