72 N 550 E Orem, UT 84097
Cascade NeighborhoodEstimated Value: $470,000 - $541,000
4
Beds
3
Baths
2,796
Sq Ft
$179/Sq Ft
Est. Value
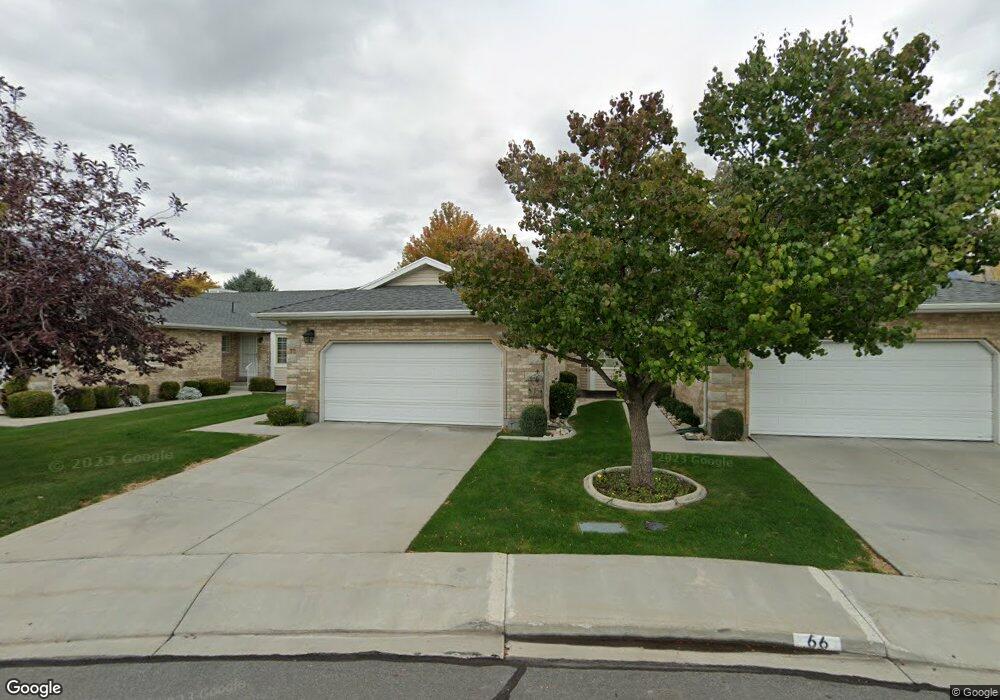
About This Home
This home is located at 72 N 550 E, Orem, UT 84097 and is currently estimated at $500,983, approximately $179 per square foot. 72 N 550 E is a home located in Utah County with nearby schools including Cascade Elementary School, Canyon View Junior High School, and Orem High School.
Ownership History
Date
Name
Owned For
Owner Type
Purchase Details
Closed on
Oct 28, 2020
Sold by
Bird La Nea
Bought by
Paulsen Sharon Lee
Current Estimated Value
Purchase Details
Closed on
May 8, 2007
Sold by
Bird Dwight
Bought by
Bird Lanea
Purchase Details
Closed on
Feb 3, 2003
Sold by
Bird Lanea
Bought by
Bird Lanea and Bird Dwight
Purchase Details
Closed on
Apr 25, 2000
Sold by
C L Christensen Brothers Inc
Bought by
Bird Lanea
Purchase Details
Closed on
Apr 19, 2000
Sold by
Christensen Richard S and Christensen Sharon W
Bought by
C L Christensen Brothers Inc
Create a Home Valuation Report for This Property
The Home Valuation Report is an in-depth analysis detailing your home's value as well as a comparison with similar homes in the area
Home Values in the Area
Average Home Value in this Area
Purchase History
| Date | Buyer | Sale Price | Title Company |
|---|---|---|---|
| Paulsen Sharon Lee | -- | Backman Orem | |
| Bird Lanea | -- | None Available | |
| Bird Lanea | -- | Mountain West Title Co | |
| Bird Lanea | -- | Mountain West Title Co | |
| C L Christensen Brothers Inc | -- | Mountain West Title Co |
Source: Public Records
Tax History
| Year | Tax Paid | Tax Assessment Tax Assessment Total Assessment is a certain percentage of the fair market value that is determined by local assessors to be the total taxable value of land and additions on the property. | Land | Improvement |
|---|---|---|---|---|
| 2025 | $2,111 | $251,460 | -- | -- |
| 2024 | $2,111 | $258,115 | $0 | $0 |
| 2023 | $1,908 | $250,800 | $0 | $0 |
| 2022 | $1,899 | $241,780 | $0 | $0 |
| 2021 | $1,714 | $330,500 | $49,600 | $280,900 |
| 2020 | $1,636 | $310,100 | $46,500 | $263,600 |
| 2019 | $1,548 | $305,100 | $45,800 | $259,300 |
| 2018 | $1,376 | $259,100 | $38,900 | $220,200 |
| 2017 | $1,281 | $129,250 | $0 | $0 |
| 2016 | $1,389 | $129,250 | $0 | $0 |
| 2015 | $1,469 | $129,250 | $0 | $0 |
| 2014 | $1,256 | $110,000 | $0 | $0 |
Source: Public Records
Map
Nearby Homes
Your Personal Tour Guide
Ask me questions while you tour the home.