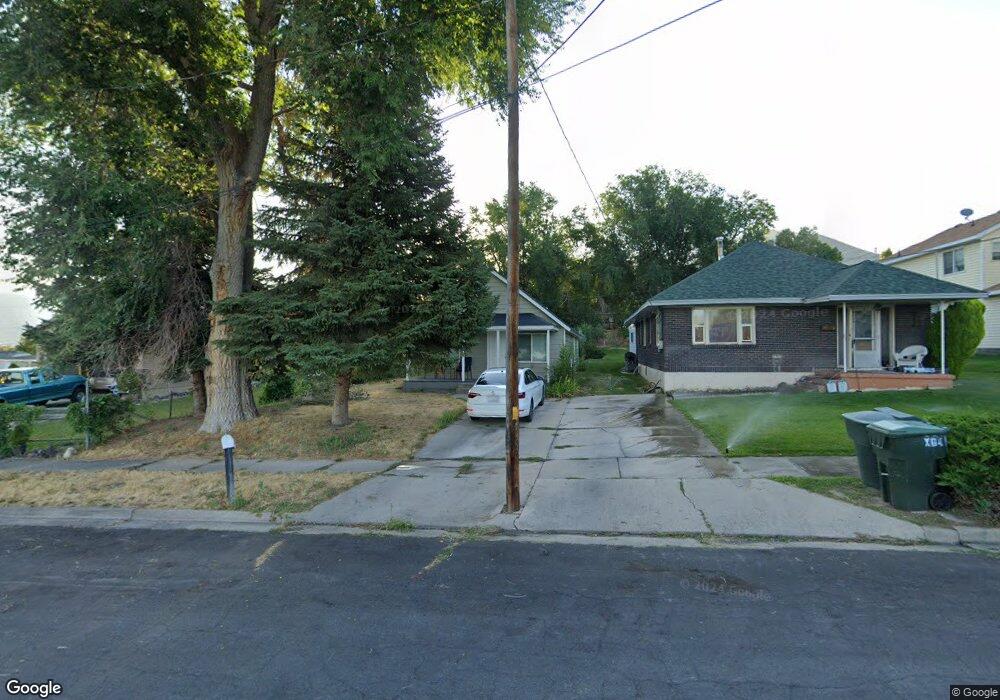
72 N 5th St Tooele, UT 84074
Estimated Value: $319,000 - $393,000
3
Beds
1
Bath
1,042
Sq Ft
$331/Sq Ft
Est. Value
About This Home
This home is located at 72 N 5th St, Tooele, UT 84074 and is currently estimated at $344,909, approximately $331 per square foot. 72 N 5th St is a home located in Tooele County with nearby schools including Sterling Elementary School, Tooele Junior High School, and Tooele High School.
Ownership History
Date
Name
Owned For
Owner Type
Purchase Details
Closed on
Jul 8, 2024
Sold by
Canyon Advantage Llc
Bought by
Gleed Caron and Jones Alexys
Current Estimated Value
Home Financials for this Owner
Home Financials are based on the most recent Mortgage that was taken out on this home.
Original Mortgage
$13,022
Outstanding Balance
$12,821
Interest Rate
7.03%
Estimated Equity
$332,088
Purchase Details
Closed on
Dec 19, 2023
Sold by
Creation Holdings Llc
Bought by
Canyon Advantage Llc
Purchase Details
Closed on
Nov 2, 2023
Sold by
Anderton Buddy James and Anderton Stephanie
Bought by
Creation Holdings Llc
Create a Home Valuation Report for This Property
The Home Valuation Report is an in-depth analysis detailing your home's value as well as a comparison with similar homes in the area
Purchase History
| Date | Buyer | Sale Price | Title Company |
|---|---|---|---|
| Gleed Caron | -- | First American Title Insurance | |
| Canyon Advantage Llc | -- | Stewart Title | |
| Creation Holdings Llc | -- | Stewart Title |
Source: Public Records
Mortgage History
| Date | Status | Borrower | Loan Amount |
|---|---|---|---|
| Open | Gleed Caron | $13,022 | |
| Open | Gleed Caron | $348,471 |
Source: Public Records
Tax History
| Year | Tax Paid | Tax Assessment Tax Assessment Total Assessment is a certain percentage of the fair market value that is determined by local assessors to be the total taxable value of land and additions on the property. | Land | Improvement |
|---|---|---|---|---|
| 2025 | $1,917 | $290,725 | $77,400 | $213,325 |
| 2024 | $2,069 | $157,953 | $42,570 | $115,383 |
| 2023 | $2,069 | $139,193 | $41,571 | $97,622 |
| 2022 | $1,340 | $115,285 | $53,460 | $61,825 |
| 2021 | $1,132 | $81,436 | $35,640 | $45,796 |
| 2020 | $951 | $118,766 | $35,500 | $83,266 |
| 2019 | $879 | $107,905 | $35,500 | $72,405 |
| 2018 | $772 | $89,852 | $35,000 | $54,852 |
| 2017 | $623 | $85,967 | $27,563 | $58,404 |
| 2016 | $540 | $43,196 | $15,160 | $28,036 |
| 2015 | $540 | $39,238 | $0 | $0 |
| 2014 | -- | $39,238 | $0 | $0 |
Source: Public Records
Map
Nearby Homes
Your Personal Tour Guide
Ask me questions while you tour the home.