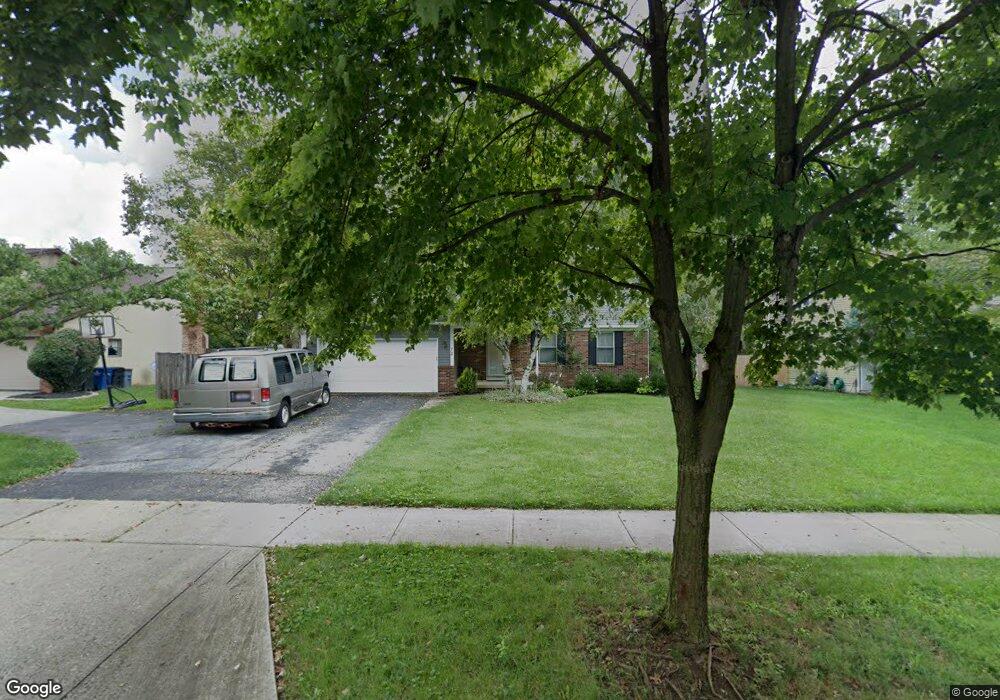
72 N Spring Rd Westerville, OH 43081
Estimated Value: $353,000 - $398,000
3
Beds
2
Baths
1,668
Sq Ft
$229/Sq Ft
Est. Value
About This Home
This home is located at 72 N Spring Rd, Westerville, OH 43081 and is currently estimated at $382,313, approximately $229 per square foot. 72 N Spring Rd is a home located in Franklin County with nearby schools including Mark Twain Elementary School, Walnut Springs Middle School, and Westerville-North High School.
Ownership History
Date
Name
Owned For
Owner Type
Purchase Details
Closed on
Nov 18, 1999
Sold by
Zajac Christine M
Bought by
Wirth M Mathew
Current Estimated Value
Purchase Details
Closed on
Jul 23, 1999
Sold by
Wirth M Mathew
Bought by
Wirth M Mathew and Zajac Christine M
Home Financials for this Owner
Home Financials are based on the most recent Mortgage that was taken out on this home.
Original Mortgage
$90,000
Interest Rate
7.69%
Purchase Details
Closed on
Nov 12, 1998
Sold by
Wood Betty J and Household Realty Corp
Bought by
Wirth M Mathew
Purchase Details
Closed on
Aug 9, 1994
Sold by
Haywood Dohn
Bought by
Betty J Wood
Home Financials for this Owner
Home Financials are based on the most recent Mortgage that was taken out on this home.
Original Mortgage
$92,800
Interest Rate
8.53%
Mortgage Type
New Conventional
Purchase Details
Closed on
Jul 10, 1990
Purchase Details
Closed on
Jul 1, 1986
Create a Home Valuation Report for This Property
The Home Valuation Report is an in-depth analysis detailing your home's value as well as a comparison with similar homes in the area
Home Values in the Area
Average Home Value in this Area
Purchase History
| Date | Buyer | Sale Price | Title Company |
|---|---|---|---|
| Wirth M Mathew | $49,800 | -- | |
| Wirth M Mathew | $49,800 | Title First Agency Inc | |
| Wirth M Mathew | $110,000 | -- | |
| Betty J Wood | $116,000 | -- | |
| -- | $100,000 | -- | |
| -- | $83,000 | -- |
Source: Public Records
Mortgage History
| Date | Status | Borrower | Loan Amount |
|---|---|---|---|
| Previous Owner | Wirth M Mathew | $90,000 | |
| Previous Owner | Betty J Wood | $92,800 |
Source: Public Records
Tax History Compared to Growth
Tax History
| Year | Tax Paid | Tax Assessment Tax Assessment Total Assessment is a certain percentage of the fair market value that is determined by local assessors to be the total taxable value of land and additions on the property. | Land | Improvement |
|---|---|---|---|---|
| 2024 | $6,250 | $109,970 | $31,500 | $78,470 |
| 2023 | $6,117 | $109,970 | $31,500 | $78,470 |
| 2022 | $5,824 | $79,940 | $21,000 | $58,940 |
| 2021 | $5,873 | $79,940 | $21,000 | $58,940 |
| 2020 | $5,856 | $79,940 | $21,000 | $58,940 |
| 2019 | $5,185 | $66,820 | $17,500 | $49,320 |
| 2018 | $4,847 | $66,820 | $17,500 | $49,320 |
| 2017 | $4,930 | $66,820 | $17,500 | $49,320 |
| 2016 | $4,760 | $56,780 | $18,380 | $38,400 |
| 2015 | $4,611 | $56,780 | $18,380 | $38,400 |
| 2014 | $4,614 | $56,780 | $18,380 | $38,400 |
| 2013 | $2,194 | $54,075 | $17,500 | $36,575 |
Source: Public Records
Map
Nearby Homes
- 768 Collingwood Dr
- 912 Lakeway Ct E
- 192 Buckeye Ct
- 589 E College Ave
- 200 Matthew Ave
- 974 Lakeland Dr
- 150 Matthew Ave
- 90 Spring Creek Dr
- 182 Hillcrest Dr
- 718 Sugar Ct
- 73 Keethler Dr S
- 417 E Park St
- 368 E College Ave
- 364 E College Ave
- 969 Farrington Dr
- 371 Delaware Dr
- 360 Potawatomi Dr
- 539 Cherrington Rd
- 1155 Ashford Ct
- 656 Olde Mill Dr
- 64 N Spring Rd
- 78 N Spring Rd
- 837 Prince William Ln
- 841 Prince William Ln
- 56 N Spring Rd
- 86 N Spring Rd
- 831 Prince William Ln
- 792 Rebecca Ave
- 845 Prince William Ln
- 79 N Spring Rd
- 173 Nicole Dr
- 44 N Spring Rd
- 179 Nicole Dr
- 793 Rebecca Ave
- 185 Nicole Dr
- 853 Prince William Ln
- 842 Prince William Ln
- 832 Prince William Ln
- 95 N Spring Rd
- 36 N Spring Rd