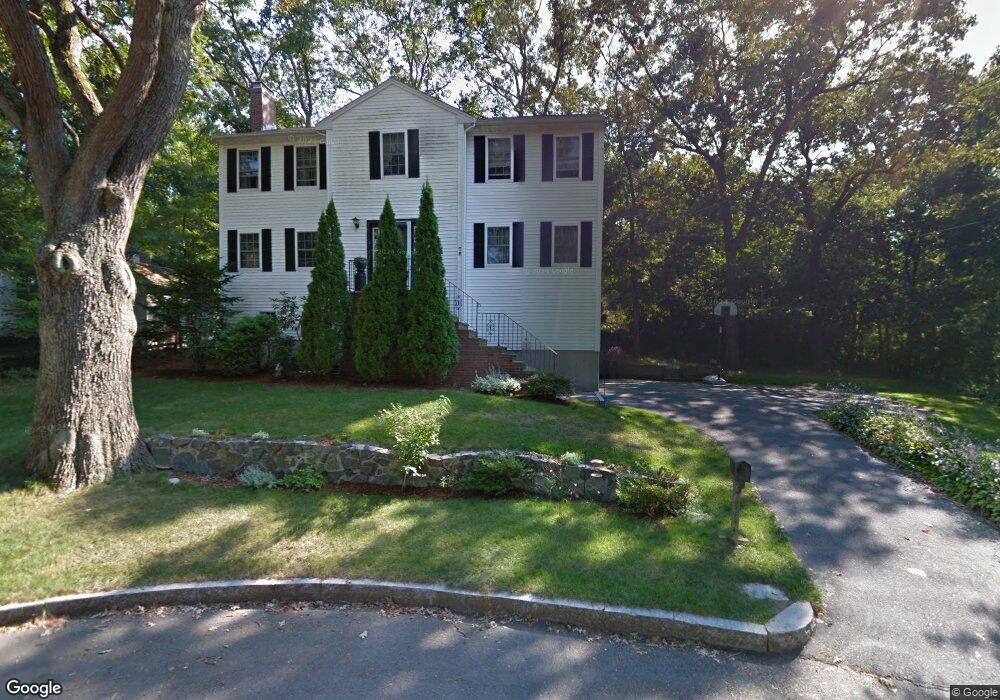
72 Norval Ave Stoneham, MA 02180
Colonial Park NeighborhoodEstimated Value: $1,115,091 - $1,262,000
4
Beds
3
Baths
2,890
Sq Ft
$401/Sq Ft
Est. Value
About This Home
This home is located at 72 Norval Ave, Stoneham, MA 02180 and is currently estimated at $1,160,023, approximately $401 per square foot. 72 Norval Ave is a home located in Middlesex County with nearby schools including Stoneham High School, St. Patrick Elementary School, and St Joseph School.
Ownership History
Date
Name
Owned For
Owner Type
Purchase Details
Closed on
Jul 31, 1998
Sold by
Ho Evon Y
Bought by
Kheboian Gary M and Kheboian Patricia A
Current Estimated Value
Home Financials for this Owner
Home Financials are based on the most recent Mortgage that was taken out on this home.
Original Mortgage
$200,000
Interest Rate
6.92%
Mortgage Type
Purchase Money Mortgage
Purchase Details
Closed on
Jan 24, 1997
Sold by
Treacy Thomas E
Bought by
Ho Evon Y
Create a Home Valuation Report for This Property
The Home Valuation Report is an in-depth analysis detailing your home's value as well as a comparison with similar homes in the area
Home Values in the Area
Average Home Value in this Area
Purchase History
| Date | Buyer | Sale Price | Title Company |
|---|---|---|---|
| Kheboian Gary M | $282,000 | -- | |
| Kheboian Gary M | $282,000 | -- | |
| Ho Evon Y | $245,450 | -- | |
| Ho Evon Y | $245,450 | -- |
Source: Public Records
Mortgage History
| Date | Status | Borrower | Loan Amount |
|---|---|---|---|
| Open | Ho Evon Y | $162,000 | |
| Closed | Ho Evon Y | $200,000 | |
| Previous Owner | Ho Evon Y | $195,000 |
Source: Public Records
Tax History
| Year | Tax Paid | Tax Assessment Tax Assessment Total Assessment is a certain percentage of the fair market value that is determined by local assessors to be the total taxable value of land and additions on the property. | Land | Improvement |
|---|---|---|---|---|
| 2025 | $9,804 | $958,400 | $380,100 | $578,300 |
| 2024 | $9,331 | $881,100 | $350,100 | $531,000 |
| 2023 | $9,019 | $812,500 | $320,100 | $492,400 |
| 2022 | $7,802 | $749,500 | $290,100 | $459,400 |
| 2021 | $7,928 | $732,700 | $280,100 | $452,600 |
| 2020 | $7,763 | $719,500 | $270,100 | $449,400 |
| 2019 | $7,736 | $689,500 | $250,100 | $439,400 |
| 2018 | $7,588 | $648,000 | $230,100 | $417,900 |
| 2017 | $7,818 | $631,000 | $220,100 | $410,900 |
| 2016 | $7,617 | $599,800 | $220,100 | $379,700 |
| 2015 | $7,479 | $577,100 | $210,100 | $367,000 |
| 2014 | $7,363 | $545,800 | $200,100 | $345,700 |
Source: Public Records
Map
Nearby Homes
- 4 Garfield Ave
- 58 Washington St
- 11 Valdora Dr
- 35 Tremont St
- 3 Valley Rd
- 51 Spring St
- 21 Tremont St Unit B
- 21 Tremont St Unit A
- 1 Tremont St
- 10 Pomeworth St Unit A
- 5 Chapel Way
- 8 Steele St
- 8 Common St Unit 3
- 62 High St Unit Lot 8
- 62 High St Unit 4
- 62 High St Unit Lot 5
- 62 High St Unit Lot 12
- 62 High St Unit 3
- 159 Main St Unit 27C
- 159 Main St Unit 39A
Your Personal Tour Guide
Ask me questions while you tour the home.