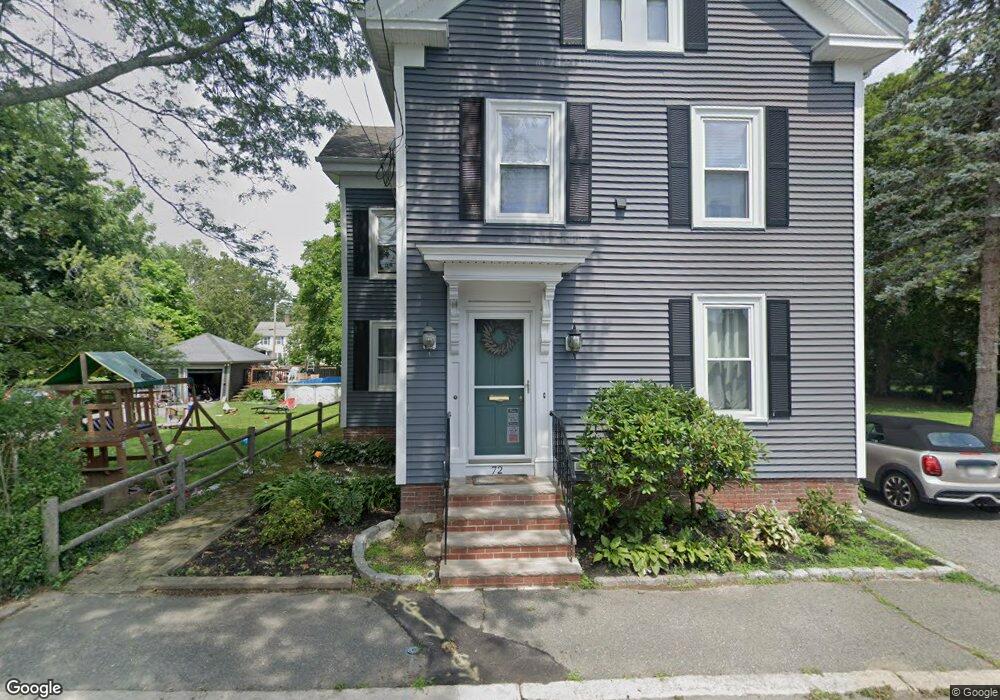
72 Orchard St Salem, MA 01970
North Salem NeighborhoodEstimated Value: $788,000 - $958,467
4
Beds
3
Baths
2,855
Sq Ft
$298/Sq Ft
Est. Value
About This Home
This home is located at 72 Orchard St, Salem, MA 01970 and is currently estimated at $851,867, approximately $298 per square foot. 72 Orchard St is a home located in Essex County with nearby schools including Bates Elementary School, Saltonstall School, and Carlton Elementary School.
Ownership History
Date
Name
Owned For
Owner Type
Purchase Details
Closed on
Dec 13, 2017
Sold by
Baga Brian
Bought by
Greene Ann M
Current Estimated Value
Home Financials for this Owner
Home Financials are based on the most recent Mortgage that was taken out on this home.
Original Mortgage
$281,000
Outstanding Balance
$202,558
Interest Rate
3.94%
Mortgage Type
New Conventional
Estimated Equity
$649,309
Purchase Details
Closed on
Mar 16, 2007
Sold by
Greene Clayton and Greene Janet
Bought by
Greene Janet
Purchase Details
Closed on
Apr 28, 2006
Sold by
Greene Janet
Bought by
Greene Janet
Create a Home Valuation Report for This Property
The Home Valuation Report is an in-depth analysis detailing your home's value as well as a comparison with similar homes in the area
Home Values in the Area
Average Home Value in this Area
Purchase History
| Date | Buyer | Sale Price | Title Company |
|---|---|---|---|
| Greene Ann M | -- | -- | |
| Greene Janet | -- | -- | |
| Greene Janet | -- | -- | |
| Greene Janet | $91,000 | -- |
Source: Public Records
Mortgage History
| Date | Status | Borrower | Loan Amount |
|---|---|---|---|
| Open | Greene Ann M | $281,000 | |
| Previous Owner | Greene Janet | $320,900 |
Source: Public Records
Tax History Compared to Growth
Tax History
| Year | Tax Paid | Tax Assessment Tax Assessment Total Assessment is a certain percentage of the fair market value that is determined by local assessors to be the total taxable value of land and additions on the property. | Land | Improvement |
|---|---|---|---|---|
| 2025 | $9,324 | $822,200 | $246,100 | $576,100 |
| 2024 | $8,785 | $756,000 | $233,900 | $522,100 |
| 2023 | $8,576 | $685,500 | $215,900 | $469,600 |
| 2022 | $8,562 | $646,200 | $208,700 | $437,500 |
| 2021 | $8,120 | $588,400 | $194,300 | $394,100 |
| 2020 | $7,825 | $541,500 | $183,500 | $358,000 |
| 2019 | $7,745 | $512,900 | $174,200 | $338,700 |
| 2018 | $7,161 | $465,600 | $165,500 | $300,100 |
| 2017 | $6,668 | $420,400 | $139,600 | $280,800 |
| 2016 | $6,486 | $413,900 | $133,100 | $280,800 |
| 2015 | $6,297 | $383,700 | $122,300 | $261,400 |
Source: Public Records
Map
Nearby Homes
- 41 Dearborn St
- 5 Larchmont Rd Unit 3
- 29R Upham St
- 29R Upham St Unit 29R
- 27 Appleton St
- 112 North St
- 18 Franklin St Unit 303
- 3 S Mason St
- 156 Bridge St Unit B
- 78 Federal St
- 103 Bridge St Unit 2
- 0 Lot 41 Map 10 Unit 73335079
- 0 Lot 61 Map 10 Unit 73335091
- 47 Federal St
- 19 Cushing St
- 17 North St Unit 2
- 15 Lynde St Unit 26
- 14 Lathrop St
- 304 Essex St Unit 1
- 26 Winter St
- 60 Orchard St
- 7 Lee St
- 78 Orchard St Unit 80
- 9 Lee St
- 5 Lee St
- 56 Orchard St
- 69 Orchard St
- 71 Orchard St
- 71 Orchard St Unit 1
- 71 Orchard St Unit 2
- 73 Orchard St Unit 2
- 86 Orchard St
- 1 Orchard Terrace
- 75 Orchard St
- 15 Lee St
- 5 Manning St
- 5 Manning St Unit 2
- 77 Orchard St
- 77 Orchard St Unit 2
- 3 Lee St