Estimated Value: $8,555,000 - $15,220,725
5
Beds
6
Baths
4,946
Sq Ft
$2,404/Sq Ft
Est. Value
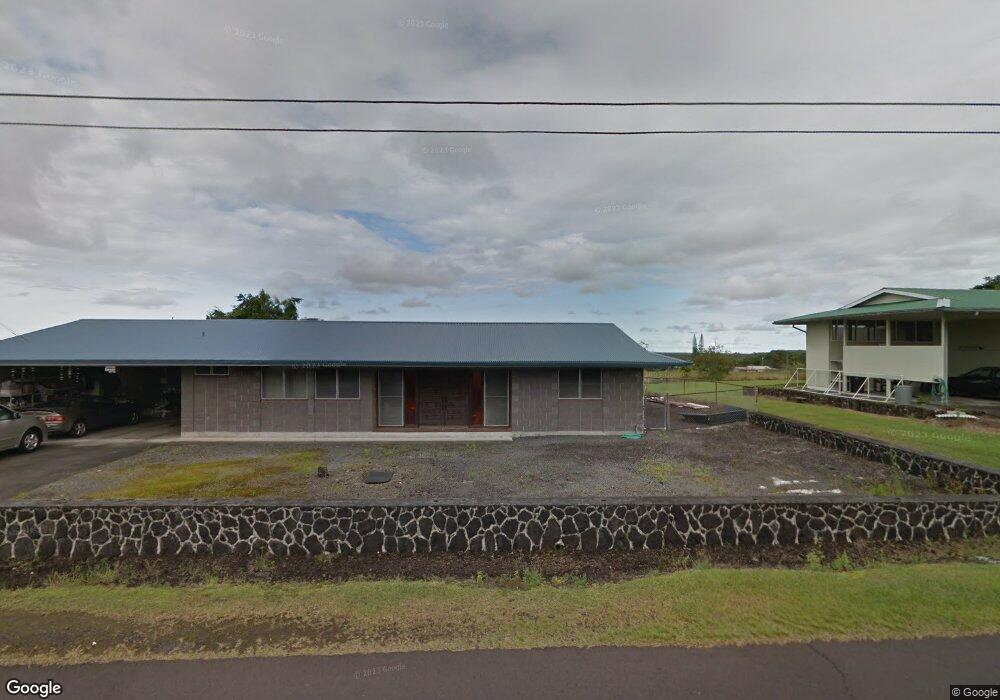
About This Home
This home is located at 72 Palua Loop Unit 3048, Hilo, HI 96720 and is currently estimated at $11,887,863, approximately $2,403 per square foot. 72 Palua Loop Unit 3048 is a home located in Hawaii County with nearby schools including Waiakeawaena Elementary School, Waiakea Intermediate School, and Waiakea High School.
Ownership History
Date
Name
Owned For
Owner Type
Purchase Details
Closed on
Nov 12, 2023
Sold by
Sfp Ii Hawaii Llc and Cycling Llc
Bought by
Sfp Ii Hawaii Llc
Current Estimated Value
Purchase Details
Closed on
Jan 18, 2013
Sold by
Busujima Hideyuki
Bought by
Sfp Ii Hawaii Llc
Purchase Details
Closed on
May 24, 2007
Sold by
Baobob Building Development Llc
Bought by
Busujima Hideyuki
Purchase Details
Closed on
May 25, 2005
Sold by
Koppes Seth C and Koppes Mary E
Bought by
Orca Development Llc
Home Financials for this Owner
Home Financials are based on the most recent Mortgage that was taken out on this home.
Original Mortgage
$4,360,000
Interest Rate
5.84%
Mortgage Type
Construction
Purchase Details
Closed on
May 20, 2004
Sold by
Wb Kukio Resorts Llc
Bought by
Koppes Seth C and Koppes Mary E
Create a Home Valuation Report for This Property
The Home Valuation Report is an in-depth analysis detailing your home's value as well as a comparison with similar homes in the area
Home Values in the Area
Average Home Value in this Area
Purchase History
| Date | Buyer | Sale Price | Title Company |
|---|---|---|---|
| Sfp Ii Hawaii Llc | -- | Title Guaranty | |
| Sfp Ii Hawaii Llc | $100,000 | Title Guaranty | |
| Sfp Ii Hawaii Llc | $5,000,000 | None Available | |
| Busujima Hideyuki | $9,500,000 | Tg | |
| Baobob Building Development Llc | $1,000 | Tg | |
| Orca Development Llc | $2,450,000 | Tg | |
| Koppes Seth C | $1,395,000 | -- |
Source: Public Records
Mortgage History
| Date | Status | Borrower | Loan Amount |
|---|---|---|---|
| Previous Owner | Orca Development Llc | $4,360,000 |
Source: Public Records
Tax History Compared to Growth
Tax History
| Year | Tax Paid | Tax Assessment Tax Assessment Total Assessment is a certain percentage of the fair market value that is determined by local assessors to be the total taxable value of land and additions on the property. | Land | Improvement |
|---|---|---|---|---|
| 2025 | $41,755 | $9,721,400 | $4,488,000 | $5,233,400 |
| 2024 | $41,755 | $7,202,700 | $2,185,400 | $5,017,300 |
| 2023 | $41,869 | $6,992,900 | $2,185,400 | $4,807,500 |
| 2022 | $40,770 | $6,789,200 | $2,185,400 | $4,603,800 |
| 2021 | $34,445 | $6,591,500 | $2,185,400 | $4,406,100 |
| 2020 | $80,525 | $6,288,600 | $1,986,700 | $4,301,900 |
| 2019 | $66,879 | $6,025,100 | $1,928,800 | $4,096,300 |
| 2018 | $66,897 | $6,026,800 | $1,928,800 | $4,098,000 |
| 2017 | $64,803 | $5,838,100 | $1,305,800 | $4,532,300 |
| 2016 | $69,123 | $6,877,900 | $1,041,800 | $5,836,100 |
| 2015 | -- | $5,813,700 | $935,500 | $4,878,200 |
| 2014 | -- | $5,226,000 | $935,500 | $4,290,500 |
Source: Public Records
Map
Nearby Homes
- 280 Laula Rd
- 155 Likeke St
- 250 Laula
- 1646 Oneawa Place
- 508 Ekela St
- 3047 Lou St
- 450 Pohakulani St
- 446 Ainaola Dr
- 1572 Kaupili Place
- 2557 Kinoole St
- 346 Kanoelani St
- 0 Ainalako Rd
- 723 W Kawailani St
- 845 Uilani Place
- 114 Hale Manu Dr
- 325 Iwalani St
- 806 Uilani Place
- 108 Hale Manu Dr
- 1588 Mailani St
- 273 Iwalani St
- 72 Palua Loop
- 60 Palua Loop
- 80 Palua Loop
- 69 Palua Loop
- 55 Palua Loop
- 81 Palua Loop
- 46 Palua Loop
- 49 Palua Loop
- 89 Palua Loop
- 93 Akea St
- 40 Palua Loop
- 100 Palua Loop
- 101 Akea St
- 85 Akea St
- 35 Palua Loop Unit 95
- 35 Palua Loop Unit 142
- 35 Palua Loop Unit 136
- 35 Palua Loop Unit 147
- 35 Palua Loop Unit 300
- 35 Palua Loop Unit 154