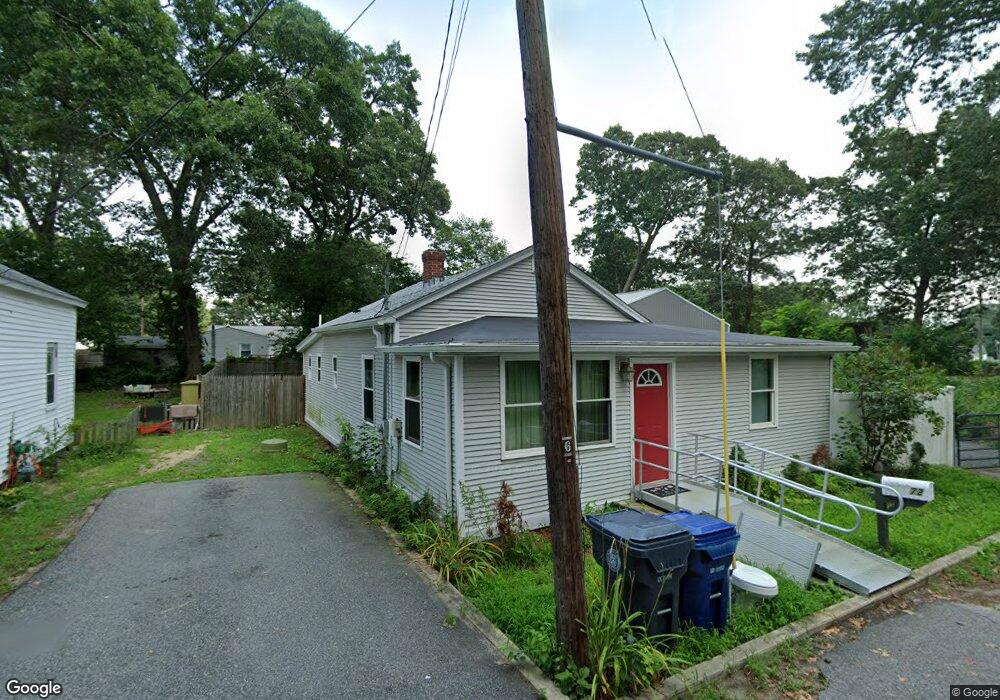
72 Plenty St Warwick, RI 02889
Buttonwoods NeighborhoodEstimated Value: $393,067 - $421,000
3
Beds
1
Bath
1,260
Sq Ft
$325/Sq Ft
Est. Value
About This Home
This home is located at 72 Plenty St, Warwick, RI 02889 and is currently estimated at $410,017, approximately $325 per square foot. 72 Plenty St is a home located in Kent County with nearby schools including Saint Kevin School and Bishop Hendricken High School.
Ownership History
Date
Name
Owned For
Owner Type
Purchase Details
Closed on
Jun 15, 2022
Sold by
Bryan J Owens Lt and Owens
Bought by
Bryan J Owens Irt and Owens
Current Estimated Value
Purchase Details
Closed on
Sep 22, 2017
Sold by
Owens Bryan J
Bought by
Owens Bryan J
Purchase Details
Closed on
Oct 11, 2013
Sold by
Owens Bryan J
Bought by
Bryan J Owens Ret and Owens
Purchase Details
Closed on
Jun 3, 1999
Sold by
Mcgrath Realty Corp
Bought by
Owens Bryan J
Create a Home Valuation Report for This Property
The Home Valuation Report is an in-depth analysis detailing your home's value as well as a comparison with similar homes in the area
Home Values in the Area
Average Home Value in this Area
Purchase History
| Date | Buyer | Sale Price | Title Company |
|---|---|---|---|
| Bryan J Owens Irt | -- | None Available | |
| Bryan J Owens Irt | -- | None Available | |
| Owens Bryan J | -- | -- | |
| Owens Bryan J | -- | -- | |
| Owens Bryan J | -- | -- | |
| Bryan J Owens Ret | -- | -- | |
| Bryan J Owens Ret | -- | -- | |
| Owens Bryan J | $20,000 | -- | |
| Owens Bryan J | $20,000 | -- |
Source: Public Records
Mortgage History
| Date | Status | Borrower | Loan Amount |
|---|---|---|---|
| Previous Owner | Owens Bryan J | $90,000 |
Source: Public Records
Tax History
| Year | Tax Paid | Tax Assessment Tax Assessment Total Assessment is a certain percentage of the fair market value that is determined by local assessors to be the total taxable value of land and additions on the property. | Land | Improvement |
|---|---|---|---|---|
| 2025 | $5,063 | $398,700 | $105,600 | $293,100 |
| 2024 | $4,483 | $309,800 | $91,800 | $218,000 |
| 2023 | $4,396 | $309,800 | $91,800 | $218,000 |
| 2022 | $3,557 | $189,900 | $55,000 | $134,900 |
| 2021 | $3,557 | $189,900 | $55,000 | $134,900 |
| 2020 | $3,557 | $189,900 | $55,000 | $134,900 |
| 2019 | $3,557 | $189,900 | $55,000 | $134,900 |
| 2018 | $3,544 | $170,400 | $55,000 | $115,400 |
| 2017 | $3,449 | $170,400 | $55,000 | $115,400 |
| 2016 | $3,449 | $170,400 | $55,000 | $115,400 |
| 2015 | $3,741 | $180,300 | $64,600 | $115,700 |
| 2014 | $3,617 | $180,300 | $64,600 | $115,700 |
| 2013 | $3,568 | $180,300 | $64,600 | $115,700 |
Source: Public Records
Map
Nearby Homes
- 31 Oakhurst Ave
- 79 Pinehurst Ave
- 71 Pinehurst Ave
- 81 Pinehurst Ave
- 73 Pinehurst Ave
- 75 Northup St
- 176 Canfield Ave
- 195 Oakland Beach Ave
- 165 Canfield Ave
- 9 Kenneth Ave
- 188 Wood St
- 107 Coburn St
- 0 Sea View Dr
- 72 Hollis Ave
- 201 Hollis Ave
- 357 Pequot Ave
- 83 Ottawa Ave
- 266 Vineyard Rd
- 52 Uncas St
- 700 Sandy Ln Unit 16
Your Personal Tour Guide
Ask me questions while you tour the home.