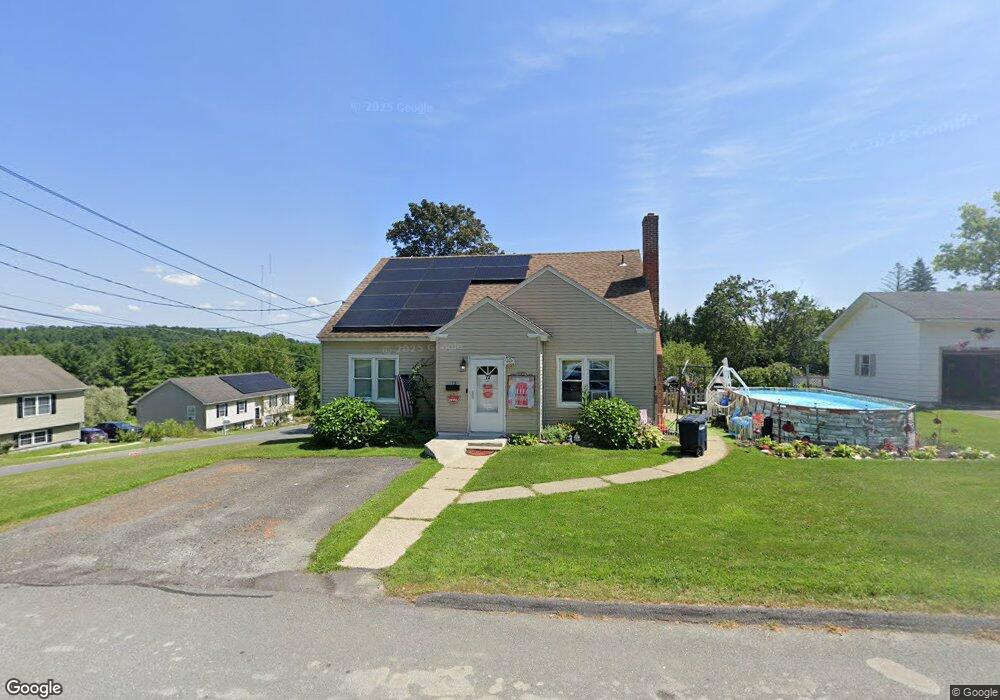
72 Plymouth St Pittsfield, MA 01201
Estimated Value: $282,000 - $295,034
3
Beds
1
Bath
1,459
Sq Ft
$199/Sq Ft
Est. Value
About This Home
This home is located at 72 Plymouth St, Pittsfield, MA 01201 and is currently estimated at $290,259, approximately $198 per square foot. 72 Plymouth St is a home located in Berkshire County with nearby schools including John T. Reid Middle School, Taconic High School, and Sinai Academy of the Berkshires.
Ownership History
Date
Name
Owned For
Owner Type
Purchase Details
Closed on
Jun 28, 2010
Sold by
Godfrey Bernard E
Bought by
Godfrey Catharine
Current Estimated Value
Purchase Details
Closed on
Jun 18, 2004
Sold by
Godfrey Bernard E and Godfrey Nancy
Bought by
Godfrey Bernard E and Godfrey Catharine
Home Financials for this Owner
Home Financials are based on the most recent Mortgage that was taken out on this home.
Original Mortgage
$5,280
Interest Rate
6.32%
Create a Home Valuation Report for This Property
The Home Valuation Report is an in-depth analysis detailing your home's value as well as a comparison with similar homes in the area
Home Values in the Area
Average Home Value in this Area
Purchase History
| Date | Buyer | Sale Price | Title Company |
|---|---|---|---|
| Godfrey Catharine | -- | -- | |
| Godfrey Catharine | -- | -- | |
| Godfrey Catharine | -- | -- | |
| Godfrey Bernard E | $50,000 | -- | |
| Godfrey Bernard E | $25,000 | -- | |
| Godfrey Bernard E | $50,000 | -- |
Source: Public Records
Mortgage History
| Date | Status | Borrower | Loan Amount |
|---|---|---|---|
| Previous Owner | Godfrey Bernard E | $5,280 | |
| Previous Owner | Godfrey Bernard E | $75,000 |
Source: Public Records
Tax History Compared to Growth
Tax History
| Year | Tax Paid | Tax Assessment Tax Assessment Total Assessment is a certain percentage of the fair market value that is determined by local assessors to be the total taxable value of land and additions on the property. | Land | Improvement |
|---|---|---|---|---|
| 2025 | $4,546 | $253,400 | $65,300 | $188,100 |
| 2024 | $4,312 | $233,700 | $65,300 | $168,400 |
| 2023 | $4,003 | $218,500 | $65,300 | $153,200 |
| 2022 | $3,686 | $198,600 | $65,300 | $133,300 |
| 2021 | $3,486 | $181,100 | $65,300 | $115,800 |
| 2020 | $3,234 | $164,100 | $52,300 | $111,800 |
| 2019 | $2,989 | $153,900 | $48,300 | $105,600 |
| 2018 | $3,002 | $150,000 | $48,300 | $101,700 |
| 2017 | $2,811 | $143,200 | $45,300 | $97,900 |
| 2016 | $2,716 | $144,800 | $45,300 | $99,500 |
| 2015 | $2,615 | $144,800 | $45,300 | $99,500 |
Source: Public Records
Map
Nearby Homes
- 47 Gale Ave
- 208 Jason St
- 93 Roselyn Dr
- 20 Greenway St
- 847 West St
- 61 Tor Ct
- 0 West St
- 191 Fort Hill Ave
- 139 Gamwell Ave
- 32 Velma Ave
- 100 Boylston Street Extension
- 8 Samson Ave
- 18 Velma Ave
- 127 Gamwell Ave
- 193 S Mountain Rd
- 1012 West St
- 71 S Church St Unit S102
- 156 Elizabeth St
- 712 Barker Rd
- 105 Onota St