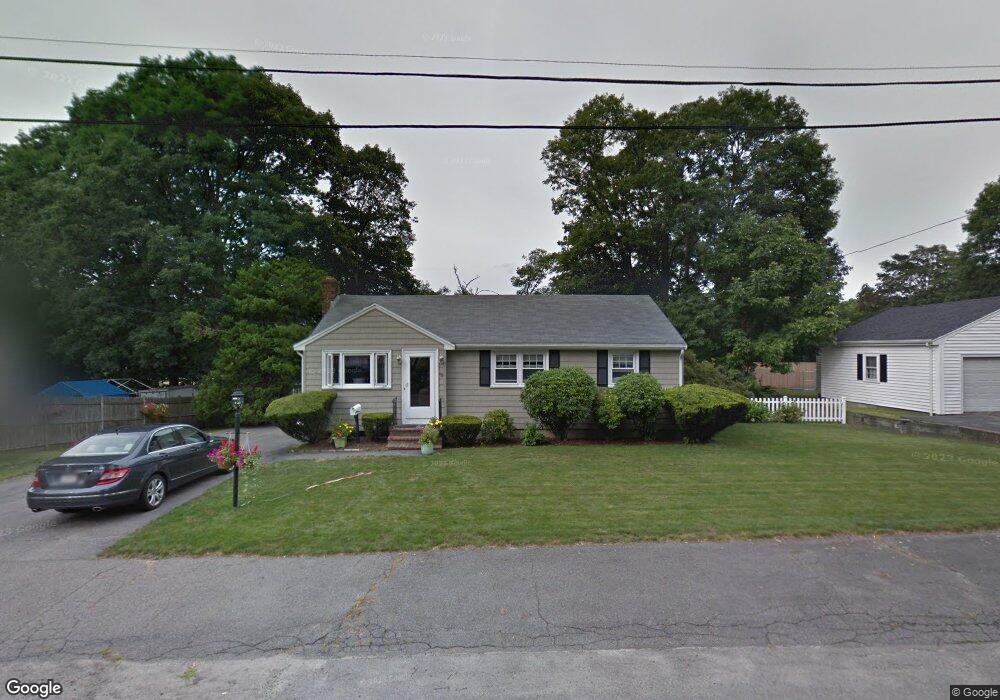
72 Progress St Weymouth, MA 02188
South Weymouth NeighborhoodEstimated Value: $525,826 - $576,000
3
Beds
1
Bath
975
Sq Ft
$562/Sq Ft
Est. Value
About This Home
This home is located at 72 Progress St, Weymouth, MA 02188 and is currently estimated at $548,207, approximately $562 per square foot. 72 Progress St is a home located in Norfolk County with nearby schools including Frederick C Murphy, Abigail Adams Middle School, and Weymouth Middle School Chapman.
Ownership History
Date
Name
Owned For
Owner Type
Purchase Details
Closed on
Apr 8, 1988
Sold by
Tangusso Paul L
Bought by
Mitchell Robert W
Current Estimated Value
Home Financials for this Owner
Home Financials are based on the most recent Mortgage that was taken out on this home.
Original Mortgage
$125,800
Interest Rate
9.89%
Mortgage Type
Purchase Money Mortgage
Create a Home Valuation Report for This Property
The Home Valuation Report is an in-depth analysis detailing your home's value as well as a comparison with similar homes in the area
Home Values in the Area
Average Home Value in this Area
Purchase History
| Date | Buyer | Sale Price | Title Company |
|---|---|---|---|
| Mitchell Robert W | $148,000 | -- |
Source: Public Records
Mortgage History
| Date | Status | Borrower | Loan Amount |
|---|---|---|---|
| Open | Mitchell Robert W | $10,000 | |
| Closed | Mitchell Robert W | $126,600 | |
| Closed | Mitchell Robert W | $125,800 |
Source: Public Records
Tax History
| Year | Tax Paid | Tax Assessment Tax Assessment Total Assessment is a certain percentage of the fair market value that is determined by local assessors to be the total taxable value of land and additions on the property. | Land | Improvement |
|---|---|---|---|---|
| 2025 | $4,865 | $481,700 | $214,200 | $267,500 |
| 2024 | $4,764 | $463,900 | $204,000 | $259,900 |
| 2023 | $4,535 | $434,000 | $188,900 | $245,100 |
| 2022 | $4,303 | $375,500 | $160,300 | $215,200 |
| 2021 | $3,911 | $333,100 | $160,300 | $172,800 |
| 2020 | $3,665 | $307,500 | $160,300 | $147,200 |
| 2019 | $3,538 | $291,900 | $154,200 | $137,700 |
| 2018 | $3,430 | $274,400 | $146,800 | $127,600 |
| 2017 | $3,423 | $267,200 | $148,100 | $119,100 |
| 2016 | $3,389 | $264,800 | $150,300 | $114,500 |
| 2015 | $3,216 | $249,300 | $143,500 | $105,800 |
| 2014 | $3,133 | $235,600 | $133,500 | $102,100 |
Source: Public Records
Map
Nearby Homes
- 501 Commerce Dr Unit 2310
- 501 Commerce Dr Unit 4308
- 82 Lester Ln
- 73 Ryder Rd
- 17 Berean Way
- 300 West St
- 107 Summer St
- 8 Tara Dr Unit 4
- 8 Tara Dr Unit 5
- 33 Congress St
- 432 Grove St
- 747 Middle St
- 15 Summer St
- 972 Liberty St
- 31 Doris Rd
- 54 Old Quarry Dr
- 2 Mitchell Ln Unit B
- 116 Greenvale Ave
- 19 Vine St Unit 3
- 19 Vine St Unit 2
- 80 Progress St
- 64 Progress St
- 75 Progress St
- 67 Progress St
- 88 Progress St
- 16 Jacquelyn Rd
- 85 Progress St
- 52 Progress St
- 51 Progress St
- 51 Progress St Unit xxxxx
- 51 Progress St Unit 1
- 51 Progress St Unit Single Fam
- 96 Progress St
- 24 Jacquelyn Rd
- 15 Jacquelyn Rd
- 44 Progress St
- 43 Progress St
- 107 Progress St
- 104 Progress St
- 27 Jacquelyn Rd
Your Personal Tour Guide
Ask me questions while you tour the home.