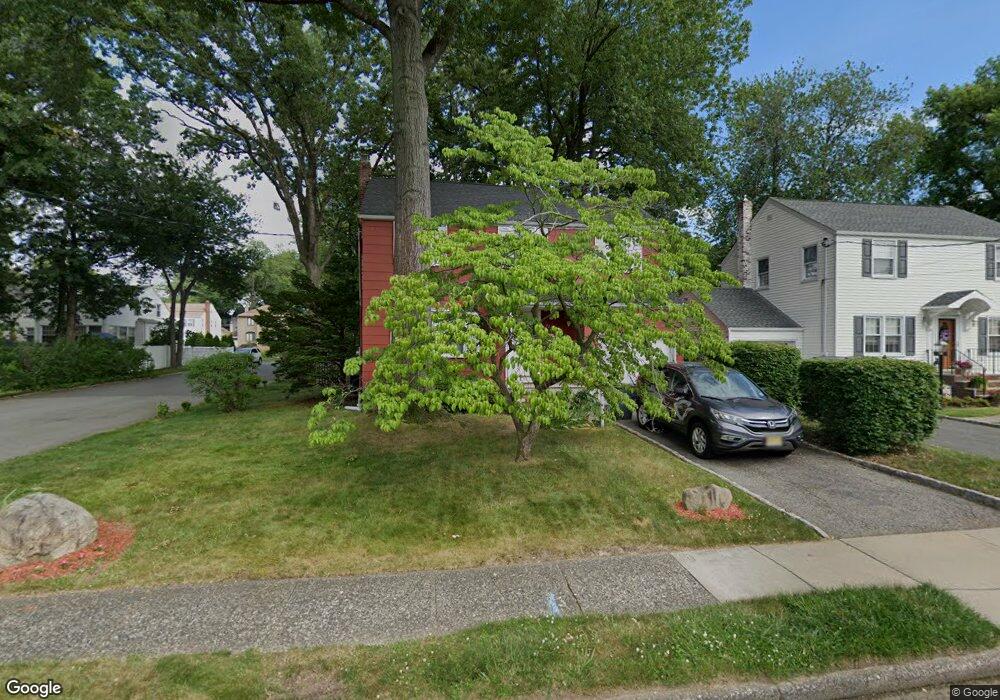
72 Renner Ave Bloomfield, NJ 07003
Estimated Value: $576,259 - $656,000
--
Bed
--
Bath
1,480
Sq Ft
$423/Sq Ft
Est. Value
About This Home
This home is located at 72 Renner Ave, Bloomfield, NJ 07003 and is currently estimated at $626,315, approximately $423 per square foot. 72 Renner Ave is a home located in Essex County with nearby schools including Oak View School, Bloomfield Middle School, and Bloomfield High School.
Ownership History
Date
Name
Owned For
Owner Type
Purchase Details
Closed on
Aug 18, 1999
Sold by
Burleigh John
Bought by
Davitt John and Davitt Laura
Current Estimated Value
Home Financials for this Owner
Home Financials are based on the most recent Mortgage that was taken out on this home.
Original Mortgage
$160,800
Outstanding Balance
$46,028
Interest Rate
7.6%
Estimated Equity
$580,287
Purchase Details
Closed on
Oct 9, 1990
Sold by
Rouse Clarence and Rouse Anna
Bought by
Burleigh John and Burleigh Grace A
Create a Home Valuation Report for This Property
The Home Valuation Report is an in-depth analysis detailing your home's value as well as a comparison with similar homes in the area
Home Values in the Area
Average Home Value in this Area
Purchase History
| Date | Buyer | Sale Price | Title Company |
|---|---|---|---|
| Davitt John | $201,000 | -- | |
| Burleigh John | $175,000 | -- | |
| Burleigh Jay | $175,000 | -- |
Source: Public Records
Mortgage History
| Date | Status | Borrower | Loan Amount |
|---|---|---|---|
| Open | Davitt John | $160,800 |
Source: Public Records
Tax History Compared to Growth
Tax History
| Year | Tax Paid | Tax Assessment Tax Assessment Total Assessment is a certain percentage of the fair market value that is determined by local assessors to be the total taxable value of land and additions on the property. | Land | Improvement |
|---|---|---|---|---|
| 2025 | $12,686 | $388,200 | $202,700 | $185,500 |
| 2024 | $12,686 | $388,200 | $202,700 | $185,500 |
| 2022 | $12,430 | $388,200 | $202,700 | $185,500 |
| 2021 | $12,201 | $388,200 | $202,700 | $185,500 |
| 2020 | $12,015 | $388,200 | $202,700 | $185,500 |
| 2019 | $12,349 | $310,200 | $181,000 | $129,200 |
| 2018 | $12,296 | $310,200 | $181,000 | $129,200 |
| 2017 | $12,110 | $310,200 | $181,000 | $129,200 |
| 2016 | $11,974 | $310,200 | $181,000 | $129,200 |
| 2015 | $11,865 | $310,200 | $181,000 | $129,200 |
| 2014 | $12,399 | $330,200 | $201,000 | $129,200 |
Source: Public Records
Map
Nearby Homes