Estimated Value: $167,545 - $218,000
3
Beds
1
Bath
1,162
Sq Ft
$172/Sq Ft
Est. Value
About This Home
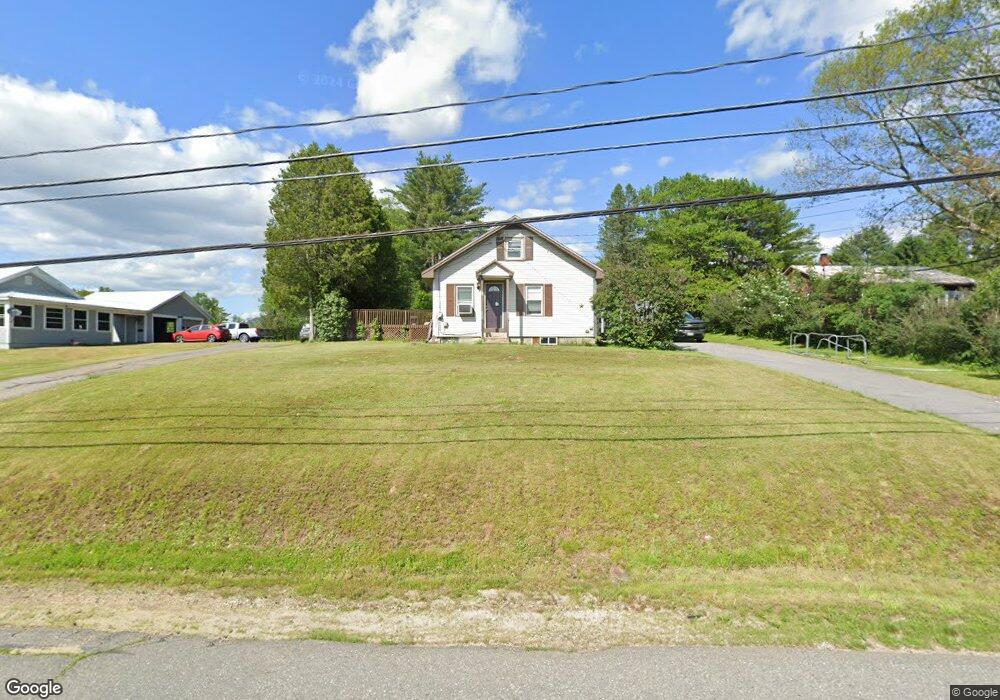
This home is located at 72 Ridge Rd, Peru, ME 04290 and is currently estimated at $199,386, approximately $171 per square foot. 72 Ridge Rd is a home located in Oxford County with nearby schools including Hezion Academy and Webb River seventh-day Adventist School.
Ownership History
Date
Name
Owned For
Owner Type
Purchase Details
Closed on
Jun 22, 2016
Sold by
Mcpherson Jason S
Bought by
Beardsley Charles R and Beardsley Caitlin M
Current Estimated Value
Home Financials for this Owner
Home Financials are based on the most recent Mortgage that was taken out on this home.
Original Mortgage
$95,243
Outstanding Balance
$74,976
Interest Rate
3.57%
Mortgage Type
FHA
Estimated Equity
$124,410
Purchase Details
Closed on
May 31, 2016
Sold by
Mcpherson Jason S and Mcpherson Tanya L
Bought by
Porter David R and Porter Kelly J
Home Financials for this Owner
Home Financials are based on the most recent Mortgage that was taken out on this home.
Original Mortgage
$95,243
Outstanding Balance
$74,976
Interest Rate
3.57%
Mortgage Type
FHA
Estimated Equity
$124,410
Create a Home Valuation Report for This Property
The Home Valuation Report is an in-depth analysis detailing your home's value as well as a comparison with similar homes in the area
Purchase History
| Date | Buyer | Sale Price | Title Company |
|---|---|---|---|
| Beardsley Charles R | -- | -- | |
| Porter David R | -- | -- |
Source: Public Records
Mortgage History
| Date | Status | Borrower | Loan Amount |
|---|---|---|---|
| Open | Beardsley Charles R | $95,243 |
Source: Public Records
Tax History
| Year | Tax Paid | Tax Assessment Tax Assessment Total Assessment is a certain percentage of the fair market value that is determined by local assessors to be the total taxable value of land and additions on the property. | Land | Improvement |
|---|---|---|---|---|
| 2024 | $1,548 | $74,600 | $11,500 | $63,100 |
| 2023 | $1,440 | $74,600 | $11,500 | $63,100 |
| 2022 | $1,343 | $74,600 | $11,500 | $63,100 |
| 2021 | $1,502 | $74,600 | $11,500 | $63,100 |
| 2020 | $424 | $74,600 | $11,500 | $63,100 |
| 2019 | $1,511 | $74,600 | $11,500 | $63,100 |
| 2017 | $391 | $74,600 | $11,500 | $63,100 |
| 2016 | $4,633 | $74,600 | $11,500 | $63,100 |
| 2015 | $1,358 | $74,600 | $11,500 | $63,100 |
| 2014 | $1,380 | $74,600 | $11,500 | $63,100 |
| 2013 | $1,306 | $74,600 | $11,500 | $63,100 |
Source: Public Records
Map
Nearby Homes
Your Personal Tour Guide
Ask me questions while you tour the home.