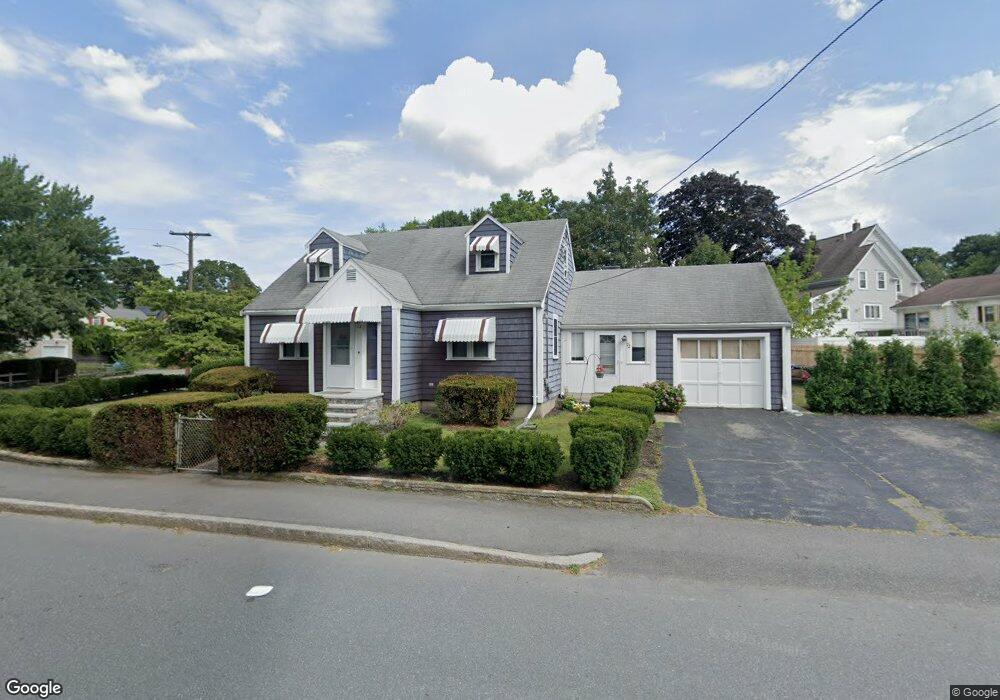
72 Roberts St Quincy, MA 02169
South Quincy NeighborhoodEstimated Value: $587,000 - $747,000
3
Beds
2
Baths
1,652
Sq Ft
$400/Sq Ft
Est. Value
About This Home
This home is located at 72 Roberts St, Quincy, MA 02169 and is currently estimated at $660,798, approximately $399 per square foot. 72 Roberts St is a home located in Norfolk County with nearby schools including South West Middle School, Lincoln-Hancock Community School, and Quincy High School.
Ownership History
Date
Name
Owned For
Owner Type
Purchase Details
Closed on
Mar 11, 2021
Sold by
Eleuteri Ft
Bought by
Segale Julia E and Segale John D
Current Estimated Value
Home Financials for this Owner
Home Financials are based on the most recent Mortgage that was taken out on this home.
Original Mortgage
$150,000
Outstanding Balance
$134,464
Interest Rate
2.7%
Mortgage Type
Purchase Money Mortgage
Estimated Equity
$526,334
Create a Home Valuation Report for This Property
The Home Valuation Report is an in-depth analysis detailing your home's value as well as a comparison with similar homes in the area
Home Values in the Area
Average Home Value in this Area
Purchase History
| Date | Buyer | Sale Price | Title Company |
|---|---|---|---|
| Segale Julia E | $450,000 | None Available |
Source: Public Records
Mortgage History
| Date | Status | Borrower | Loan Amount |
|---|---|---|---|
| Open | Segale Julia E | $150,000 |
Source: Public Records
Tax History Compared to Growth
Tax History
| Year | Tax Paid | Tax Assessment Tax Assessment Total Assessment is a certain percentage of the fair market value that is determined by local assessors to be the total taxable value of land and additions on the property. | Land | Improvement |
|---|---|---|---|---|
| 2025 | $7,002 | $607,300 | $309,500 | $297,800 |
| 2024 | $6,649 | $590,000 | $294,700 | $295,300 |
| 2023 | $6,054 | $543,900 | $267,900 | $276,000 |
| 2022 | $5,912 | $493,500 | $223,300 | $270,200 |
| 2021 | $5,868 | $483,400 | $223,300 | $260,100 |
| 2020 | $5,981 | $481,200 | $223,300 | $257,900 |
| 2019 | $5,497 | $438,000 | $210,600 | $227,400 |
| 2018 | $5,376 | $403,000 | $195,100 | $207,900 |
| 2017 | $5,141 | $362,800 | $185,700 | $177,100 |
| 2016 | $4,691 | $326,700 | $161,600 | $165,100 |
| 2015 | $4,682 | $320,700 | $161,600 | $159,100 |
| 2014 | $4,397 | $295,900 | $161,600 | $134,300 |
Source: Public Records
Map
Nearby Homes
- 203 Centre St
- 64 Garfield St Unit B
- 21 Arthur St
- 21 Totman St Unit 204
- 21 Totman St Unit 306
- 21 Totman St Unit 410
- 21 Totman St Unit 309
- 21 Totman St Unit Model-1
- 21 Totman St Unit 202
- 21 Totman St Unit 2
- 12 Arthur Ave
- 14 Arthur Ave
- 347 Centre St
- 72 Centre St Unit J
- 33 Brook Rd
- 36 Greystone St Unit 36
- 57 Buckley St
- 8 Jackson St Unit B2
- 55 Station St Unit 1
- 42 West St
- 102 Gilbert St
- 63 Nightingale Ave
- 73 Nightingale Ave Unit 2nd floor
- 73 Nightingale Ave
- 53 Nightingale Ave
- 69 Nightingale Ave Unit 1st floor
- 67 Nightingale Ave
- 69 Nightingale Ave
- 75 Roberts St
- 98 Gilbert St
- 55 Nightingale Ave
- 97 Gilbert St
- 51 Nightingale Ave
- 79 Roberts St
- 92 Gilbert St
- 81 Nightingale Ave Unit 2
- 88 Gilbert St
- 45 Nightingale Ave
- 52 Roberts St
- 47 Nightingale Ave