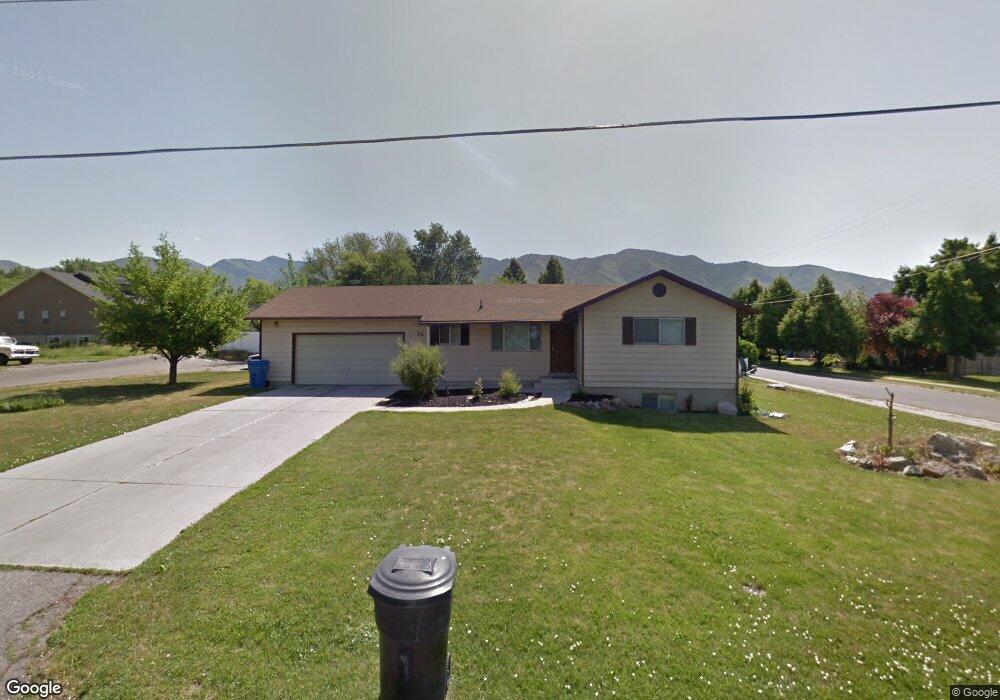
72 S 400 E Hyde Park, UT 84318
Estimated Value: $415,843 - $472,000
Studio
--
Bath
1,098
Sq Ft
$401/Sq Ft
Est. Value
About This Home
This home is located at 72 S 400 E, Hyde Park, UT 84318 and is currently estimated at $440,211, approximately $400 per square foot. 72 S 400 E is a home with nearby schools including North Park School, Cedar Ridge School, and North Cache Middle School.
Ownership History
Date
Name
Owned For
Owner Type
Purchase Details
Closed on
Nov 27, 2019
Sold by
Balls Benjamine and Balls Angela
Bought by
Balls Robert J and Balls Sue B
Current Estimated Value
Purchase Details
Closed on
Mar 16, 2007
Sold by
Balls Ben and Balls Angela
Bought by
Balls Benjamin and Balls Angela
Home Financials for this Owner
Home Financials are based on the most recent Mortgage that was taken out on this home.
Original Mortgage
$148,800
Interest Rate
6.31%
Mortgage Type
New Conventional
Purchase Details
Closed on
Dec 28, 2001
Sold by
Balls Robert J and Balls Sue
Bought by
Balls Ben and Balls Angela
Home Financials for this Owner
Home Financials are based on the most recent Mortgage that was taken out on this home.
Original Mortgage
$90,000
Interest Rate
7.11%
Mortgage Type
Seller Take Back
Create a Home Valuation Report for This Property
The Home Valuation Report is an in-depth analysis detailing your home's value as well as a comparison with similar homes in the area
Home Values in the Area
Average Home Value in this Area
Purchase History
| Date | Buyer | Sale Price | Title Company |
|---|---|---|---|
| Balls Robert J | -- | Pinnacle Title Ins Agcy Inc | |
| Balls Benjamin | -- | Pinnacle Title Ins Agency | |
| Balls Ben | -- | Hickman Land Title Company |
Source: Public Records
Mortgage History
| Date | Status | Borrower | Loan Amount |
|---|---|---|---|
| Closed | Balls Benjamin | $148,800 | |
| Closed | Balls Ben | $90,000 |
Source: Public Records
Tax History
| Year | Tax Paid | Tax Assessment Tax Assessment Total Assessment is a certain percentage of the fair market value that is determined by local assessors to be the total taxable value of land and additions on the property. | Land | Improvement |
|---|---|---|---|---|
| 2025 | $1,596 | $220,070 | $0 | $0 |
| 2024 | $1,649 | $209,660 | $0 | $0 |
| 2023 | $1,709 | $206,720 | $0 | $0 |
| 2022 | $1,778 | $206,720 | $0 | $0 |
| 2021 | $1,683 | $307,420 | $79,300 | $228,120 |
| 2020 | $1,551 | $269,400 | $79,300 | $190,100 |
| 2019 | $1,506 | $248,200 | $79,300 | $168,900 |
| 2018 | $1,212 | $195,966 | $52,830 | $143,136 |
| 2017 | $1,168 | $99,345 | $0 | $0 |
| 2016 | $1,184 | $99,345 | $0 | $0 |
| 2015 | $1,172 | $99,345 | $0 | $0 |
| 2014 | $992 | $86,335 | $0 | $0 |
| 2013 | -- | $86,335 | $0 | $0 |
Source: Public Records
Map
Nearby Homes
- 520 E 100 S
- 1110 E 100 S Unit 216
- 600 E 100 S
- 895 E 100 N Unit 11
- 710 E 100 S
- 307 S 400 E
- 488 E 250 S
- 164 E 200 S
- 1138 E 200 N Unit 37
- 1124 E 200 N Unit 38
- 375 N 400 E
- 458 W Madison St S
- 1130 E 245 N
- 201 N 1000 E Unit 19
- 1109 E 245 N
- 830 E 410 N Unit 161
- 635 S 125 E Unit 120
- 454 W Madison St S
- 1070 E 200 N Unit 24
- 480 N 729 E
Your Personal Tour Guide
Ask me questions while you tour the home.