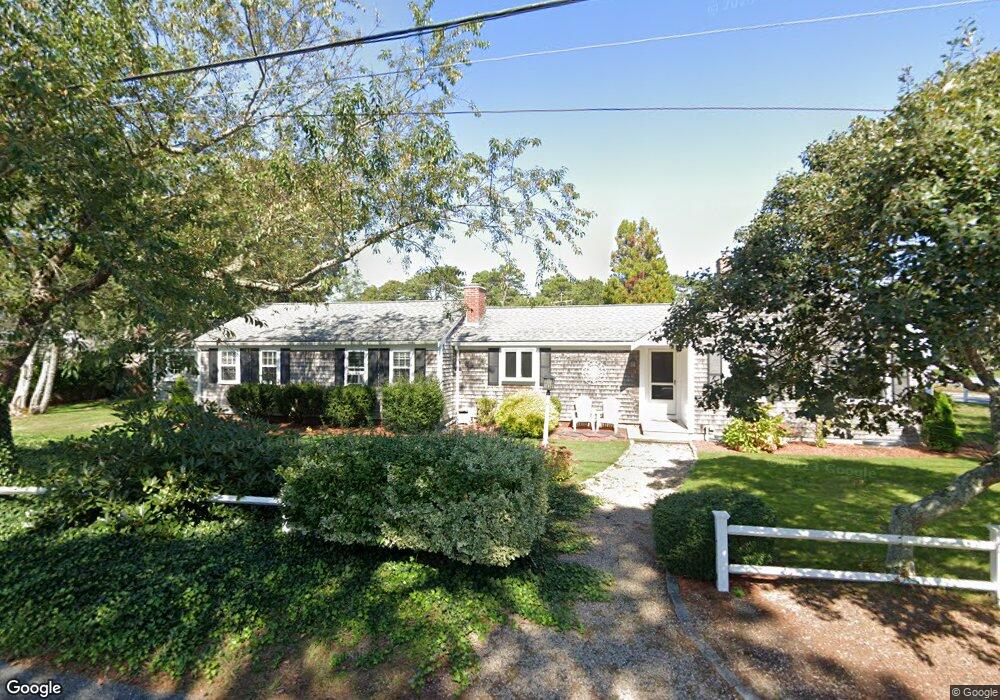
72 Santucket Rd West Dennis, MA 02670
West Dennis NeighborhoodEstimated Value: $905,000 - $1,060,000
3
Beds
2
Baths
1,488
Sq Ft
$663/Sq Ft
Est. Value
About This Home
This home is located at 72 Santucket Rd, West Dennis, MA 02670 and is currently estimated at $986,812, approximately $663 per square foot. 72 Santucket Rd is a home located in Barnstable County with nearby schools including Dennis-Yarmouth Regional High School and St. Pius X. School.
Ownership History
Date
Name
Owned For
Owner Type
Purchase Details
Closed on
Sep 24, 2007
Sold by
Doris B Sargent Ret
Bought by
Iseler David G and Iseler Lynn M
Current Estimated Value
Home Financials for this Owner
Home Financials are based on the most recent Mortgage that was taken out on this home.
Original Mortgage
$350,000
Outstanding Balance
$222,277
Interest Rate
6.63%
Mortgage Type
Purchase Money Mortgage
Estimated Equity
$764,535
Create a Home Valuation Report for This Property
The Home Valuation Report is an in-depth analysis detailing your home's value as well as a comparison with similar homes in the area
Home Values in the Area
Average Home Value in this Area
Purchase History
| Date | Buyer | Sale Price | Title Company |
|---|---|---|---|
| Iseler David G | $477,000 | -- |
Source: Public Records
Mortgage History
| Date | Status | Borrower | Loan Amount |
|---|---|---|---|
| Open | Iseler David G | $350,000 |
Source: Public Records
Tax History Compared to Growth
Tax History
| Year | Tax Paid | Tax Assessment Tax Assessment Total Assessment is a certain percentage of the fair market value that is determined by local assessors to be the total taxable value of land and additions on the property. | Land | Improvement |
|---|---|---|---|---|
| 2025 | $4,143 | $956,900 | $426,800 | $530,100 |
| 2024 | $3,731 | $849,800 | $342,100 | $507,700 |
| 2023 | $3,609 | $772,700 | $311,000 | $461,700 |
| 2022 | $3,483 | $621,900 | $280,100 | $341,800 |
| 2021 | $3,541 | $587,300 | $274,600 | $312,700 |
| 2020 | $3,307 | $542,200 | $305,100 | $237,100 |
| 2019 | $3,145 | $509,700 | $299,200 | $210,500 |
| 2018 | $2,840 | $447,900 | $256,300 | $191,600 |
| 2017 | $2,718 | $441,900 | $256,300 | $185,600 |
| 2016 | $2,748 | $420,800 | $262,000 | $158,800 |
| 2015 | $2,693 | $420,800 | $262,000 | $158,800 |
| 2014 | $2,527 | $398,000 | $239,200 | $158,800 |
Source: Public Records
Map
Nearby Homes
- 2 Rita Mary Way
- 178 School St
- 14 Schoolhouse Ln
- 209 Main St Unit 3
- 209 Main St Unit 6
- 209 Main St Unit 1
- 209 Main St Unit 2
- 209 Main St Unit 4
- 209 Main St Unit 5
- 23 Doric Ave
- 401 Main St Unit 201
- 401 Main St Unit 101
- 467 Main St
- 428 Main St Unit 1-11
- 308 Old Main St
- 6 Baker Way
- 45 Seth Ln
- 181 Pleasant St
- 61 Trotters Ln
- 40 Kelley Rd