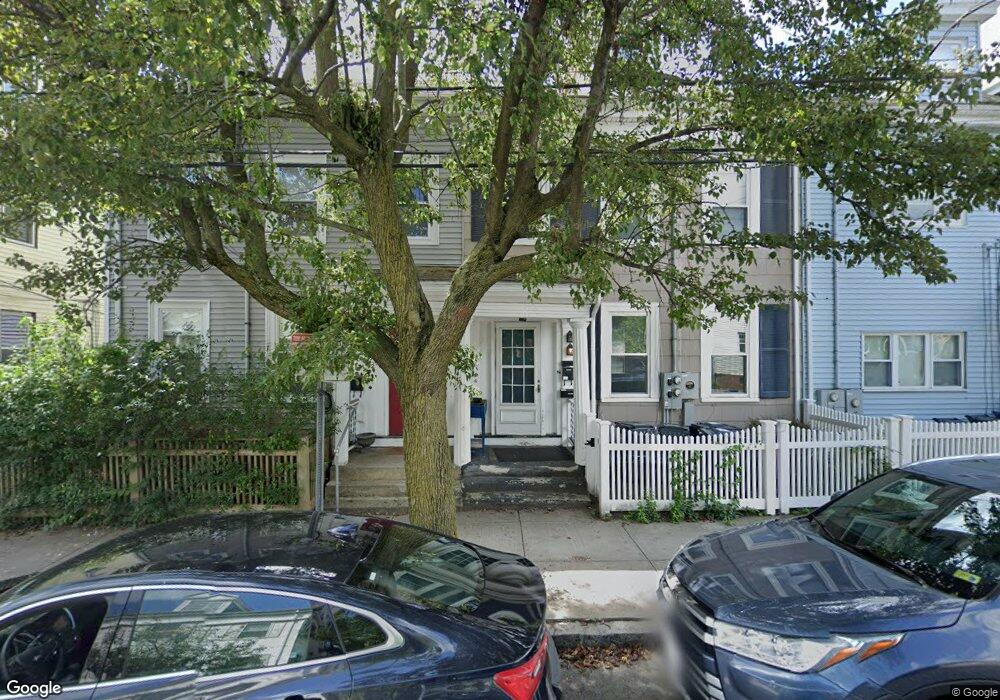
72 Spring St Cambridge, MA 02141
East Cambridge NeighborhoodEstimated Value: $1,396,000 - $1,697,000
3
Beds
3
Baths
999
Sq Ft
$1,545/Sq Ft
Est. Value
About This Home
Central Air Dishwasher Disposal Eat-In Kitchen Hardwood Floors Laundry in Unit Microwave Oven/Range Refrigerator
323511 870
Ownership History
Date
Name
Owned For
Owner Type
Purchase Details
Closed on
Mar 3, 2016
Sold by
Poillucci Irt and Rose
Bought by
Mishkin Danielle E and Rose Joseph E
Current Estimated Value
Home Financials for this Owner
Home Financials are based on the most recent Mortgage that was taken out on this home.
Original Mortgage
$420,000
Outstanding Balance
$329,665
Interest Rate
3.81%
Mortgage Type
New Conventional
Estimated Equity
$1,214,068
Create a Home Valuation Report for This Property
The Home Valuation Report is an in-depth analysis detailing your home's value as well as a comparison with similar homes in the area
Home Values in the Area
Average Home Value in this Area
Purchase History
| Date | Buyer | Sale Price | Title Company |
|---|---|---|---|
| Mishkin Danielle E | $630,000 | -- | |
| Poillucci Irt | -- | -- |
Source: Public Records
Mortgage History
| Date | Status | Borrower | Loan Amount |
|---|---|---|---|
| Open | Mishkin Danielle E | $420,000 |
Source: Public Records
Property History
| Date | Event | Price | List to Sale | Price per Sq Ft |
|---|---|---|---|---|
| 10/08/2024 10/08/24 | Off Market | $5,050 | -- | -- |
| 06/30/2024 06/30/24 | For Rent | $5,050 | -- | -- |
Tax History
| Year | Tax Paid | Tax Assessment Tax Assessment Total Assessment is a certain percentage of the fair market value that is determined by local assessors to be the total taxable value of land and additions on the property. | Land | Improvement |
|---|---|---|---|---|
| 2025 | $7,947 | $1,251,500 | $647,900 | $603,600 |
| 2024 | $7,192 | $1,214,900 | $693,800 | $521,100 |
| 2023 | $6,941 | $1,184,400 | $662,400 | $522,000 |
| 2022 | $6,647 | $1,122,800 | $656,800 | $466,000 |
| 2021 | $6,391 | $1,092,500 | $644,500 | $448,000 |
| 2020 | $6,357 | $1,105,600 | $650,500 | $455,100 |
| 2019 | $6,339 | $1,067,100 | $638,100 | $429,000 |
| 2018 | $7,234 | $897,500 | $529,100 | $368,400 |
| 2017 | $5,337 | $822,400 | $473,100 | $349,300 |
| 2016 | $4,859 | $695,200 | $370,400 | $324,800 |
| 2015 | $4,737 | $605,700 | $317,500 | $288,200 |
| 2014 | $4,220 | $503,600 | $245,900 | $257,700 |
Source: Public Records
Map
Nearby Homes
- 50 Spring St
- 76-78 Thorndike St
- 93 Third St
- 78 Otis St
- 259 Hurley St Unit 4
- 30 2nd St Unit B
- 30 2nd St Unit A
- 30
- 17 Otis St Unit 602
- 303 Hurley St
- 68 Gore St
- 169 Monsignor Obrien Hwy Unit 605
- 10 Rogers St Unit 606
- 10 Rogers St Unit 703
- 10 Rogers St Unit PH4
- 6 Canal Park Unit 602
- 6 Canal Park Unit 105
- 4 Canal Park Unit PH9
- 4 Canal Park Unit PH8
- 262 Monsignor Obrien Hwy Unit 503
- 74 Spring St
- 72 Spring St Unit 1A
- 72 Spring St Unit 1T
- 72 Spring St Unit 70-3
- 72 Spring St Unit 3
- 72 Spring St Unit 2
- 74 Spring St Unit 1
- 74 Spring St Unit 2
- 76 Spring St
- 78 Spring St
- 78 Spring St Unit 1
- 70 Spring St Unit 1
- 70 Spring St Unit 3
- 70 Spring St
- 70 Spring St
- 68 Spring St
- 68 Spring St Unit 2
- 68 Spring St Unit 70 3
- 80 Spring St
- 80 Spring St Unit 3
Your Personal Tour Guide
Ask me questions while you tour the home.