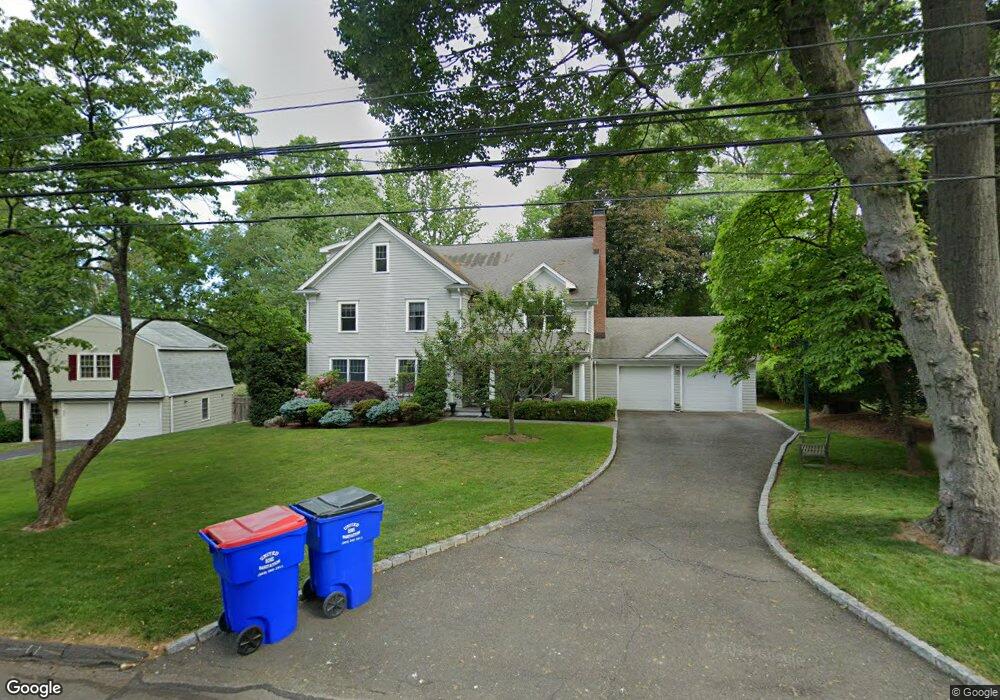
72 Stoneleigh Rd Fairfield, CT 06825
Stratfield Village NeighborhoodEstimated Value: $1,153,767 - $1,418,000
4
Beds
4
Baths
4,018
Sq Ft
$316/Sq Ft
Est. Value
About This Home
This home is located at 72 Stoneleigh Rd, Fairfield, CT 06825 and is currently estimated at $1,267,692, approximately $315 per square foot. 72 Stoneleigh Rd is a home located in Fairfield County with nearby schools including North Stratfield Elementary School, Fairfield Woods Middle School, and Fairfield Warde High School.
Ownership History
Date
Name
Owned For
Owner Type
Purchase Details
Closed on
Feb 18, 2021
Sold by
Tavolacci Nancy C
Bought by
Tavolacci Francis P
Current Estimated Value
Purchase Details
Closed on
Jul 2, 2009
Sold by
Lee Sophia
Bought by
Tavolacci Frnacis P and Tavolacci Nancy A
Home Financials for this Owner
Home Financials are based on the most recent Mortgage that was taken out on this home.
Original Mortgage
$671,681
Interest Rate
4.86%
Purchase Details
Closed on
May 3, 2004
Sold by
Stoneleigh Designs Llc
Bought by
Lee Jin and Lee Sophie
Home Financials for this Owner
Home Financials are based on the most recent Mortgage that was taken out on this home.
Original Mortgage
$704,000
Interest Rate
5.36%
Purchase Details
Closed on
Dec 11, 2003
Sold by
Koski Sylvia
Bought by
Stoneleigh Designs Llc
Create a Home Valuation Report for This Property
The Home Valuation Report is an in-depth analysis detailing your home's value as well as a comparison with similar homes in the area
Home Values in the Area
Average Home Value in this Area
Purchase History
| Date | Buyer | Sale Price | Title Company |
|---|---|---|---|
| Tavolacci Francis P | -- | None Available | |
| Tavolacci Francis P | -- | None Available | |
| Tavolacci Frnacis P | $935,000 | -- | |
| Tavolacci Frnacis P | $935,000 | -- | |
| Lee Jin | $887,000 | -- | |
| Lee Jin | $887,000 | -- | |
| Stoneleigh Designs Llc | $450,000 | -- | |
| Stoneleigh Designs Llc | $450,000 | -- |
Source: Public Records
Mortgage History
| Date | Status | Borrower | Loan Amount |
|---|---|---|---|
| Previous Owner | Stoneleigh Designs Llc | $671,681 | |
| Previous Owner | Stoneleigh Designs Llc | $704,000 |
Source: Public Records
Tax History
| Year | Tax Paid | Tax Assessment Tax Assessment Total Assessment is a certain percentage of the fair market value that is determined by local assessors to be the total taxable value of land and additions on the property. | Land | Improvement |
|---|---|---|---|---|
| 2025 | $14,666 | $516,600 | $233,310 | $283,290 |
| 2024 | $14,413 | $516,600 | $233,310 | $283,290 |
| 2023 | $14,212 | $516,600 | $233,310 | $283,290 |
| 2022 | $14,072 | $516,600 | $233,310 | $283,290 |
| 2021 | $13,938 | $516,600 | $233,310 | $283,290 |
| 2020 | $15,848 | $591,570 | $254,590 | $336,980 |
| 2019 | $15,848 | $591,570 | $254,590 | $336,980 |
| 2018 | $15,594 | $591,570 | $254,590 | $336,980 |
| 2017 | $15,274 | $591,570 | $254,590 | $336,980 |
| 2016 | $15,055 | $591,570 | $254,590 | $336,980 |
| 2015 | $13,964 | $563,290 | $290,360 | $272,930 |
| 2014 | $13,744 | $563,290 | $290,360 | $272,930 |
Source: Public Records
Map
Nearby Homes
- 168 Bennett St
- 1924 Stratfield Rd
- 35 Balmaha Ct
- 16 Paisley Ln Unit 16
- 65 Bailey Rd
- 232 Church Hill Rd
- 250 Lockwood Rd
- 90 Lu Manor Dr
- 419 Valley Rd
- 160 Glengarry Rd Unit 160
- 1452 Melville Ave Unit 1452
- 3989 Park Ave
- 101 Applegate Rd
- 357 Harvester Rd
- 8 Nelson Place
- 220 Melville Dr
- 71 Schiller Rd
- 932 Thorme St
- 720 Queen St
- 260 Toilsome Place
- 52 Stoneleigh Rd
- 90 Stoneleigh Rd
- 51 Stoneleigh Rd
- 34 Stoneleigh Rd
- 51 Meadowcrest Dr
- 69 Stoneleigh Rd
- 85 Meadowcrest Dr
- 10 Stoneleigh Rd
- 93 Stoneleigh Rd
- 594 Church Hill Rd
- 624 Church Hill Rd
- 47 Stoneleigh Rd
- 125 Stoneleigh Rd
- 642 Church Hill Rd
- 15 Stoneleigh Rd
- 2 Stoneleigh Rd
- 109 Meadowcrest Dr
- 66 Meadowcrest Dr
- 38 Meadowcrest Dr
- 13 Stoneleigh Rd
Your Personal Tour Guide
Ask me questions while you tour the home.