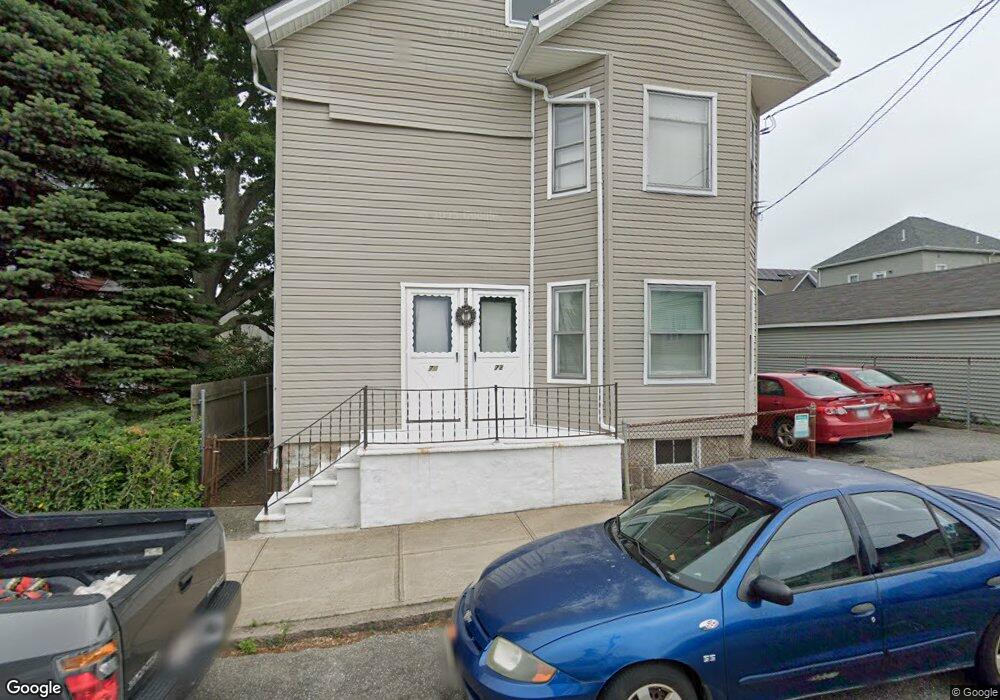
72 Talbot St Fall River, MA 02723
Flint NeighborhoodEstimated Value: $445,000 - $518,000
6
Beds
2
Baths
2,310
Sq Ft
$210/Sq Ft
Est. Value
About This Home
This home is located at 72 Talbot St, Fall River, MA 02723 and is currently estimated at $485,546, approximately $210 per square foot. 72 Talbot St is a home located in Bristol County with nearby schools including Mary Fonseca Elementary School, Talbot Innovation School, and B M C Durfee High School.
Ownership History
Date
Name
Owned For
Owner Type
Purchase Details
Closed on
Feb 3, 2015
Sold by
Dupuis Janice M and Schmidt Laurie A
Bought by
Talbot Street Rt
Current Estimated Value
Purchase Details
Closed on
Jun 7, 2011
Sold by
Rodrigues Edward P
Bought by
Rodrigues Bento J and Dupuis Janice M
Home Financials for this Owner
Home Financials are based on the most recent Mortgage that was taken out on this home.
Original Mortgage
$44,000
Interest Rate
3.8%
Purchase Details
Closed on
May 11, 2009
Sold by
Rodrigues Jeanette Leona and Schmidt Laurie A
Bought by
Rodrigues Bento J and Dupuis Janice M
Create a Home Valuation Report for This Property
The Home Valuation Report is an in-depth analysis detailing your home's value as well as a comparison with similar homes in the area
Home Values in the Area
Average Home Value in this Area
Purchase History
| Date | Buyer | Sale Price | Title Company |
|---|---|---|---|
| Talbot Street Rt | -- | -- | |
| Rodrigues Bento J | $43,000 | -- | |
| Rodrigues Bento J | -- | -- |
Source: Public Records
Mortgage History
| Date | Status | Borrower | Loan Amount |
|---|---|---|---|
| Previous Owner | Rodrigues Bento J | $44,000 | |
| Previous Owner | Rodrigues Bento J | $43,000 | |
| Previous Owner | Rodrigues Bento J | $18,000 |
Source: Public Records
Tax History
| Year | Tax Paid | Tax Assessment Tax Assessment Total Assessment is a certain percentage of the fair market value that is determined by local assessors to be the total taxable value of land and additions on the property. | Land | Improvement |
|---|---|---|---|---|
| 2025 | $3,933 | $343,500 | $107,400 | $236,100 |
| 2024 | $3,772 | $328,300 | $103,400 | $224,900 |
| 2023 | $3,286 | $267,800 | $85,400 | $182,400 |
| 2022 | $3,402 | $269,600 | $81,400 | $188,200 |
| 2021 | $3,139 | $227,000 | $77,400 | $149,600 |
| 2020 | $2,821 | $195,200 | $76,300 | $118,900 |
| 2019 | $2,670 | $183,100 | $73,500 | $109,600 |
| 2018 | $2,561 | $175,200 | $79,600 | $95,600 |
| 2017 | $2,321 | $165,800 | $75,800 | $90,000 |
| 2016 | $2,294 | $168,300 | $80,700 | $87,600 |
| 2015 | $2,201 | $168,300 | $80,700 | $87,600 |
| 2014 | $2,191 | $174,200 | $78,300 | $95,900 |
Source: Public Records
Map
Nearby Homes
- 150 Downing St
- 165 Eastern Ave
- 580 County St
- 70 Jencks St
- 88 Harrison St Unit 5
- 178 Thomas St
- 10 Carlisa Dr
- 1244 Pleasant St
- 129 County St
- 756 County St
- 1155-1157 Pleasant St
- 529 Eastern Ave
- 243 Oak Grove Ave
- 84 Healy St
- 139 Quarry St
- 31 Choate St
- 869 Bedford St
- 152 Alden St
- 25 Lebanon St Unit D
- 25 Lebanon St Unit C
Your Personal Tour Guide
Ask me questions while you tour the home.