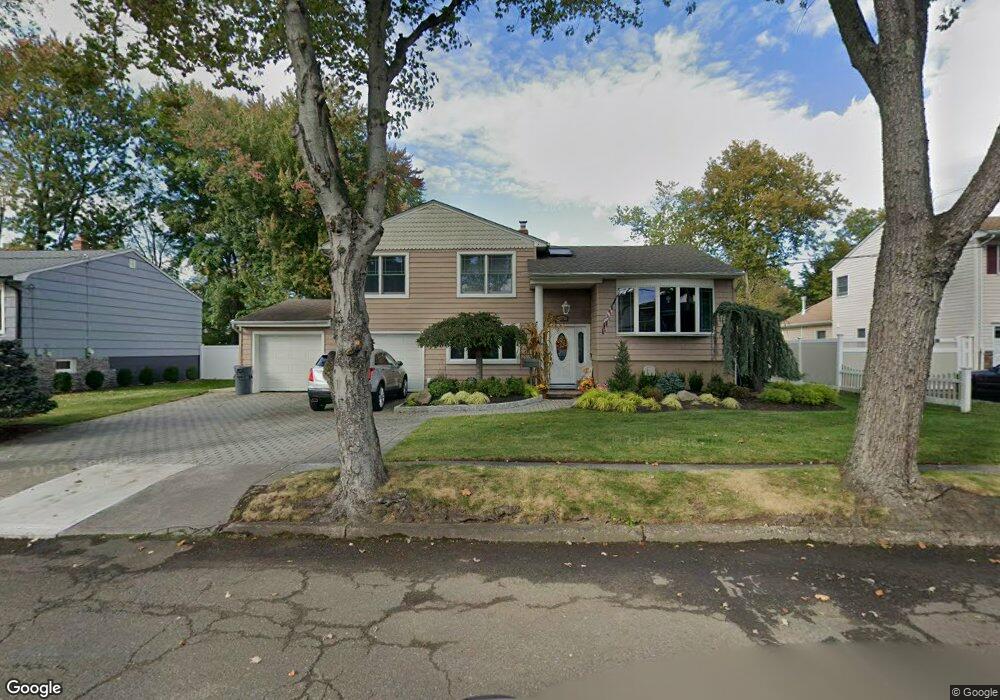
72 Teak Rd Dumont, NJ 07628
Estimated Value: $763,000 - $996,000
--
Bed
--
Bath
3,383
Sq Ft
$263/Sq Ft
Est. Value
About This Home
This home is located at 72 Teak Rd, Dumont, NJ 07628 and is currently estimated at $891,007, approximately $263 per square foot. 72 Teak Rd is a home located in Bergen County with nearby schools including Dumont High School and Institute For Educational Achievement.
Ownership History
Date
Name
Owned For
Owner Type
Purchase Details
Closed on
Jul 28, 2006
Current Estimated Value
Purchase Details
Closed on
Jul 21, 2006
Sold by
Kato Junzo
Bought by
Capone Edward S and Capone Rosemarie A
Purchase Details
Closed on
Apr 15, 1997
Sold by
Blum Harold B and Blum Barbara A
Bought by
Kato Junzo and Kato Anita
Home Financials for this Owner
Home Financials are based on the most recent Mortgage that was taken out on this home.
Original Mortgage
$239,000
Interest Rate
7.76%
Create a Home Valuation Report for This Property
The Home Valuation Report is an in-depth analysis detailing your home's value as well as a comparison with similar homes in the area
Home Values in the Area
Average Home Value in this Area
Purchase History
| Date | Buyer | Sale Price | Title Company |
|---|---|---|---|
| -- | $580,900 | -- | |
| Capone Edward S | $580,870 | -- | |
| Kato Junzo | $265,000 | -- |
Source: Public Records
Mortgage History
| Date | Status | Borrower | Loan Amount |
|---|---|---|---|
| Previous Owner | Kato Junzo | $239,000 |
Source: Public Records
Tax History Compared to Growth
Tax History
| Year | Tax Paid | Tax Assessment Tax Assessment Total Assessment is a certain percentage of the fair market value that is determined by local assessors to be the total taxable value of land and additions on the property. | Land | Improvement |
|---|---|---|---|---|
| 2025 | $18,959 | $801,800 | $348,700 | $453,100 |
| 2024 | $18,493 | $466,400 | $212,900 | $253,500 |
| 2023 | $18,110 | $466,400 | $212,900 | $253,500 |
| 2022 | $18,110 | $466,400 | $212,900 | $253,500 |
| 2021 | $18,022 | $466,400 | $212,900 | $253,500 |
| 2020 | $17,532 | $466,400 | $212,900 | $253,500 |
| 2019 | $17,112 | $466,400 | $212,900 | $253,500 |
| 2018 | $16,762 | $466,400 | $212,900 | $253,500 |
| 2017 | $16,441 | $466,400 | $212,900 | $253,500 |
| 2016 | $16,058 | $466,400 | $212,900 | $253,500 |
| 2015 | $15,690 | $466,400 | $212,900 | $253,500 |
| 2014 | $15,382 | $466,400 | $212,900 | $253,500 |
Source: Public Records
Map
Nearby Homes