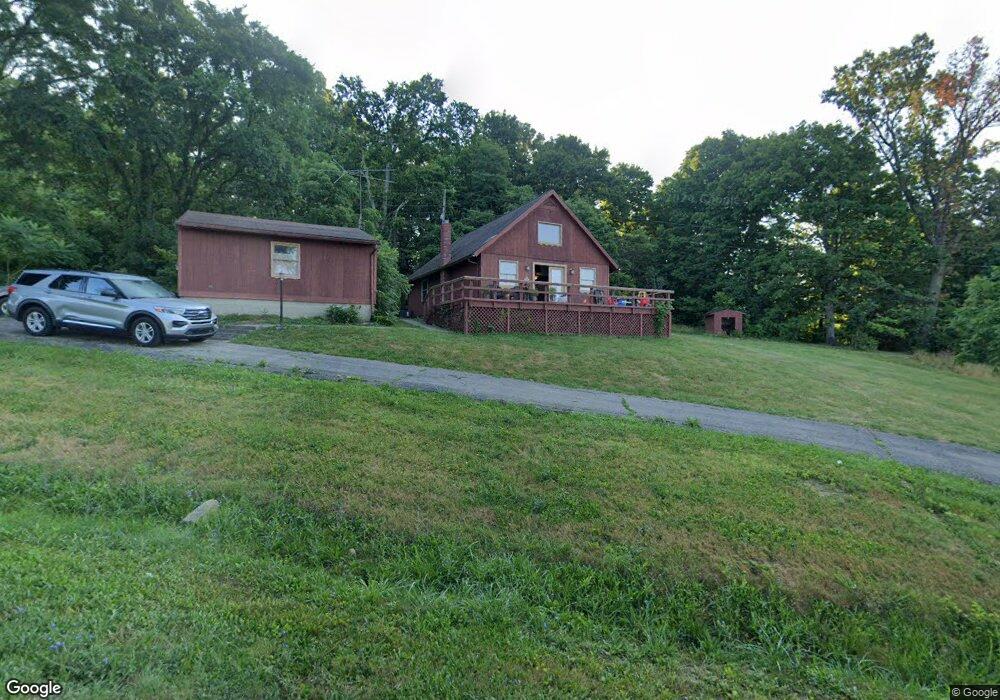
72 Terrace Dr Chillicothe, OH 45601
Estimated Value: $194,000 - $247,000
2
Beds
1
Bath
1,046
Sq Ft
$212/Sq Ft
Est. Value
About This Home
This home is located at 72 Terrace Dr, Chillicothe, OH 45601 and is currently estimated at $222,121, approximately $212 per square foot. 72 Terrace Dr is a home located in Ross County with nearby schools including Unioto Elementary School, Unioto Middle School, and Unioto High School.
Ownership History
Date
Name
Owned For
Owner Type
Purchase Details
Closed on
May 31, 2022
Sold by
Wonderleigh Maria R
Bought by
Wonderleigh Maria R and Wonderleigh Joshua L
Current Estimated Value
Home Financials for this Owner
Home Financials are based on the most recent Mortgage that was taken out on this home.
Original Mortgage
$132,000
Outstanding Balance
$124,409
Interest Rate
4.25%
Mortgage Type
New Conventional
Estimated Equity
$97,712
Purchase Details
Closed on
Dec 18, 2015
Sold by
Orem Stuart W and Orem Rebecca L
Bought by
Murray Maria R and Wonderleigh Joshua L E
Home Financials for this Owner
Home Financials are based on the most recent Mortgage that was taken out on this home.
Original Mortgage
$122,365
Interest Rate
3.96%
Mortgage Type
New Conventional
Purchase Details
Closed on
May 19, 2014
Sold by
Beam Susan E
Bought by
Orem Stuart W and Orem Rebecca L
Create a Home Valuation Report for This Property
The Home Valuation Report is an in-depth analysis detailing your home's value as well as a comparison with similar homes in the area
Home Values in the Area
Average Home Value in this Area
Purchase History
| Date | Buyer | Sale Price | Title Company |
|---|---|---|---|
| Wonderleigh Maria R | -- | None Listed On Document | |
| Murray Maria R | $119,000 | Arrow Title | |
| Orem Stuart W | $62,000 | Chicago Title |
Source: Public Records
Mortgage History
| Date | Status | Borrower | Loan Amount |
|---|---|---|---|
| Open | Wonderleigh Maria R | $132,000 | |
| Previous Owner | Murray Maria R | $122,365 |
Source: Public Records
Tax History Compared to Growth
Tax History
| Year | Tax Paid | Tax Assessment Tax Assessment Total Assessment is a certain percentage of the fair market value that is determined by local assessors to be the total taxable value of land and additions on the property. | Land | Improvement |
|---|---|---|---|---|
| 2024 | $1,613 | $46,770 | $8,770 | $38,000 |
| 2023 | $1,613 | $46,770 | $8,770 | $38,000 |
| 2022 | $1,648 | $46,770 | $8,770 | $38,000 |
| 2021 | $1,399 | $37,130 | $7,070 | $30,060 |
| 2020 | $1,406 | $37,130 | $7,070 | $30,060 |
| 2019 | $1,406 | $37,130 | $7,070 | $30,060 |
| 2018 | $1,268 | $32,810 | $7,070 | $25,740 |
| 2017 | $1,270 | $32,810 | $7,070 | $25,740 |
| 2016 | $1,237 | $32,810 | $7,070 | $25,740 |
| 2015 | $1,253 | $32,060 | $7,070 | $24,990 |
| 2014 | $1,224 | $32,060 | $7,070 | $24,990 |
| 2013 | $870 | $32,060 | $7,070 | $24,990 |
Source: Public Records
Map
Nearby Homes
- 25 Woodland Way
- 265 Brookside Dr
- 2153 Egypt Pike
- 45 Custer Dr
- 13223 Pleasant Valley Rd
- 12690 Pleasant Valley Rd
- 1036 Clinton Rd
- 18 Sarah Ct
- 14996 Pleasant Valley Rd Unit Lot 60
- 14996 Pleasant Valley Rd Unit Lot 70
- 14996 Pleasant Valley Rd Unit Lot 53
- 559 Golfview Dr
- 2083 Anderson Station Rd
- 11303 County Road 550
- 88 Fruit Hill Dr
- 365 Golfview Dr
- 847 Pine St
- 763 Buckeye St
- 631 Orange St
- 23 Delaware Dr
- 71 Terrace Dr
- 93 Terrace Dr
- 127 Woodland Way
- 114 Terrace Dr
- 2446 Egypt Pike
- 14 Terrace Dr
- 145 Terrace Dr
- 145 Terrace Dr
- 2417 Egypt Pike
- 119 Woodland Way
- 119 Woodland Way
- 175 Woodland Way
- 141 Woodland Way Unit 14
- 146 Terrace Dr
- 191 Woodland Way
- 89 Woodland Way
- Lot#28 Woodland Way
- 0 Woodland Way
- 2421 Egypt Pike
- 25 Woodland Way Unit 7