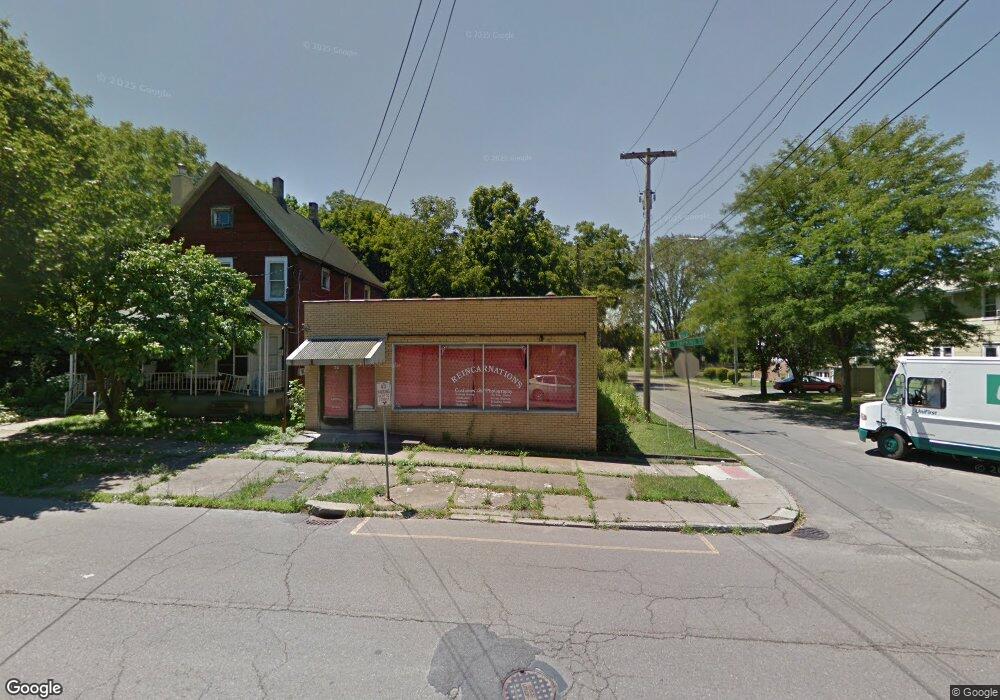
72 Tompkins St Binghamton, NY 13903
Southside East Binghamton NeighborhoodEstimated Value: $99,085
--
Bed
--
Bath
2,400
Sq Ft
$41/Sq Ft
Est. Value
About This Home
This home is located at 72 Tompkins St, Binghamton, NY 13903 and is currently estimated at $99,085, approximately $41 per square foot. 72 Tompkins St is a home located in Broome County with nearby schools including Benjamin Franklin Elementary School, Binghamton High School, and East Middle School.
Ownership History
Date
Name
Owned For
Owner Type
Purchase Details
Closed on
May 12, 2023
Sold by
Heer Balwant S
Bought by
Kamalesh Llc
Current Estimated Value
Purchase Details
Closed on
Apr 19, 2023
Sold by
Richard John
Bought by
Heer Balwant S
Purchase Details
Closed on
Mar 4, 2023
Sold by
Paugh Agnes
Bought by
Heer Balwant S
Purchase Details
Closed on
Mar 12, 2002
Sold by
Richard Vienna G
Bought by
Richard John
Create a Home Valuation Report for This Property
The Home Valuation Report is an in-depth analysis detailing your home's value as well as a comparison with similar homes in the area
Home Values in the Area
Average Home Value in this Area
Purchase History
| Date | Buyer | Sale Price | Title Company |
|---|---|---|---|
| Kamalesh Llc | -- | None Listed On Document | |
| Kamalesh Llc | -- | None Listed On Document | |
| Heer Balwant S | $80,000 | None Listed On Document | |
| Heer Balwant S | $30,000 | None Listed On Document | |
| Richard John | -- | Robert B Thomas |
Source: Public Records
Tax History Compared to Growth
Tax History
| Year | Tax Paid | Tax Assessment Tax Assessment Total Assessment is a certain percentage of the fair market value that is determined by local assessors to be the total taxable value of land and additions on the property. | Land | Improvement |
|---|---|---|---|---|
| 2024 | $6,597 | $67,800 | $10,800 | $57,000 |
| 2023 | $6,560 | $67,800 | $10,800 | $57,000 |
| 2022 | $6,406 | $67,800 | $10,800 | $57,000 |
| 2021 | $6,334 | $67,800 | $10,800 | $57,000 |
| 2020 | $6,355 | $67,800 | $10,800 | $57,000 |
| 2019 | $3,388 | $67,800 | $10,800 | $57,000 |
| 2018 | $6,174 | $67,800 | $10,800 | $57,000 |
| 2017 | $6,207 | $67,800 | $10,800 | $57,000 |
| 2016 | $6,243 | $67,800 | $10,800 | $57,000 |
| 2015 | $5,517 | $67,800 | $10,800 | $57,000 |
| 2014 | $5,517 | $67,800 | $10,800 | $57,000 |
Source: Public Records
Map
Nearby Homes