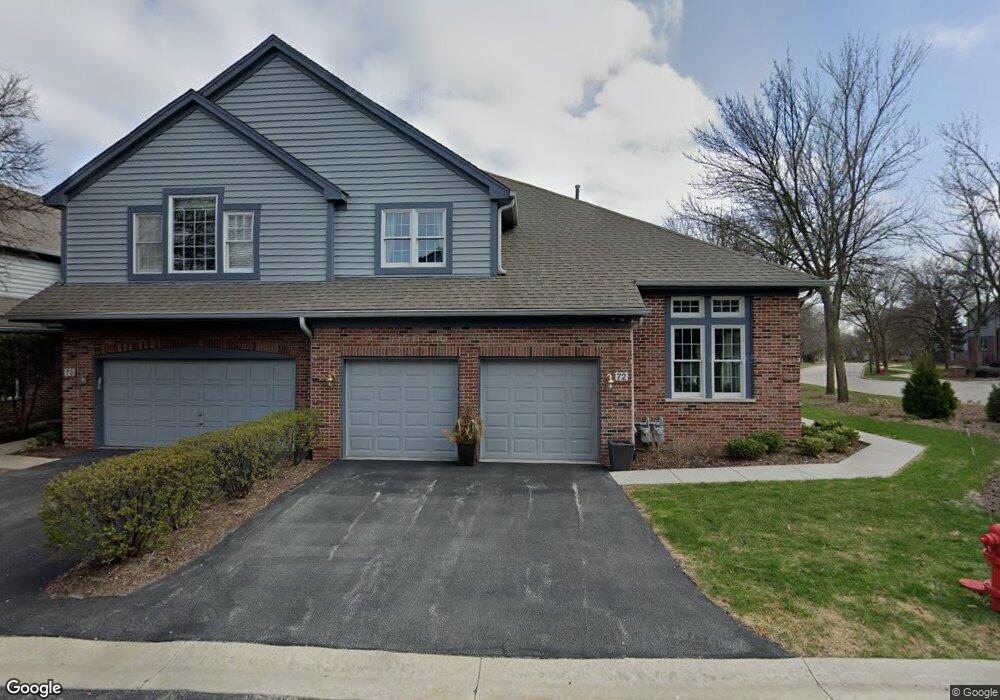
72 Trent Ct Unit 72 Burr Ridge, IL 60527
Burr Ridge East NeighborhoodEstimated Value: $627,744 - $783,000
2
Beds
2
Baths
2,200
Sq Ft
$323/Sq Ft
Est. Value
About This Home
This home is located at 72 Trent Ct Unit 72, Burr Ridge, IL 60527 and is currently estimated at $711,186, approximately $323 per square foot. 72 Trent Ct Unit 72 is a home located in Cook County with nearby schools including Pleasantdale Elementary School, Pleasantdale Middle School, and Lyons Township High School.
Ownership History
Date
Name
Owned For
Owner Type
Purchase Details
Closed on
Jun 29, 2001
Sold by
Wilson John M and Wilson Barbara M
Bought by
Littley Peter and Littley Linda P
Current Estimated Value
Home Financials for this Owner
Home Financials are based on the most recent Mortgage that was taken out on this home.
Original Mortgage
$250,000
Interest Rate
7.27%
Purchase Details
Closed on
Jul 15, 1997
Sold by
Maccartie Thaddeus R and Maccartie Mary Jane
Bought by
Wilson John M and Wilson Barbara M
Home Financials for this Owner
Home Financials are based on the most recent Mortgage that was taken out on this home.
Original Mortgage
$262,000
Interest Rate
7.25%
Purchase Details
Closed on
Oct 26, 1995
Sold by
Burr Ridge Associates
Bought by
Maccartie Thaddeus R and Maccartie Mary Jane
Home Financials for this Owner
Home Financials are based on the most recent Mortgage that was taken out on this home.
Original Mortgage
$185,000
Interest Rate
7.56%
Create a Home Valuation Report for This Property
The Home Valuation Report is an in-depth analysis detailing your home's value as well as a comparison with similar homes in the area
Home Values in the Area
Average Home Value in this Area
Purchase History
| Date | Buyer | Sale Price | Title Company |
|---|---|---|---|
| Littley Peter | $445,000 | -- | |
| Wilson John M | $337,000 | -- | |
| Maccartie Thaddeus R | $326,500 | -- |
Source: Public Records
Mortgage History
| Date | Status | Borrower | Loan Amount |
|---|---|---|---|
| Closed | Littley Peter | $250,000 | |
| Previous Owner | Wilson John M | $262,000 | |
| Previous Owner | Maccartie Thaddeus R | $185,000 |
Source: Public Records
Tax History Compared to Growth
Tax History
| Year | Tax Paid | Tax Assessment Tax Assessment Total Assessment is a certain percentage of the fair market value that is determined by local assessors to be the total taxable value of land and additions on the property. | Land | Improvement |
|---|---|---|---|---|
| 2024 | $7,595 | $45,903 | $7,100 | $38,803 |
| 2023 | $7,878 | $45,903 | $7,100 | $38,803 |
| 2022 | $7,878 | $42,086 | $5,594 | $36,492 |
| 2021 | $8,210 | $42,085 | $5,593 | $36,492 |
| 2020 | $7,997 | $42,085 | $5,593 | $36,492 |
| 2019 | $7,834 | $41,957 | $5,163 | $36,794 |
| 2018 | $7,994 | $41,957 | $5,163 | $36,794 |
| 2017 | $7,712 | $41,957 | $5,163 | $36,794 |
| 2016 | $7,085 | $34,850 | $4,518 | $30,332 |
| 2015 | $7,048 | $34,850 | $4,518 | $30,332 |
| 2014 | $6,706 | $34,850 | $4,518 | $30,332 |
| 2013 | $5,936 | $31,959 | $4,518 | $27,441 |
Source: Public Records
Map
Nearby Homes
- 17 Ambriance Dr
- 1000 Village Center Dr Unit 409
- 7254 Fair Elms Ave
- 11315 77th St
- 8010 Greenbriar Ct
- 11225 Arrowhead Trail
- 8120 Woodside Ln
- 7211 Wolf Rd Unit 301A
- 7231 Wolf Rd Unit 310C
- 8101 S County Line Rd
- 219 79th St
- 124 Fairway Dr
- 8080 Wolf Rd
- 7339 S Park Ave
- 124 Carriage Way Dr Unit 212B
- 128 Carriage Way Dr Unit 116B
- 11702 German Church Rd
- 7213 Giddings Ave
- 8302 Pleasant View Ave
- 11307 German Church Rd
- 73 Trent Ct Unit 73
- 75 Trent Ct Unit 75
- 95 Trent Ct Unit 95
- 96 Trent Ct Unit 96
- 97 Trent Ct Unit 97
- 66 Huntington Ct Unit 66
- 94 Trent Ct Unit 94
- 65 Huntington Ct Unit 65
- 76 Trent Ct Unit 76
- 114 Northgate Place Unit 114
- 116 Northgate Place Unit 116
- 92 Trent Ct Unit 92
- 77 Trent Ct Unit 77
- 115 Northgate Place Unit 115
- 91 Trent Ct Unit 91
- 78 Trent Ct Unit 78
- 137 Northgate Place Unit 137
- 90 Trent Ct Unit 90
- 1 Waterside Place
- 117 Northgate Place Unit 117