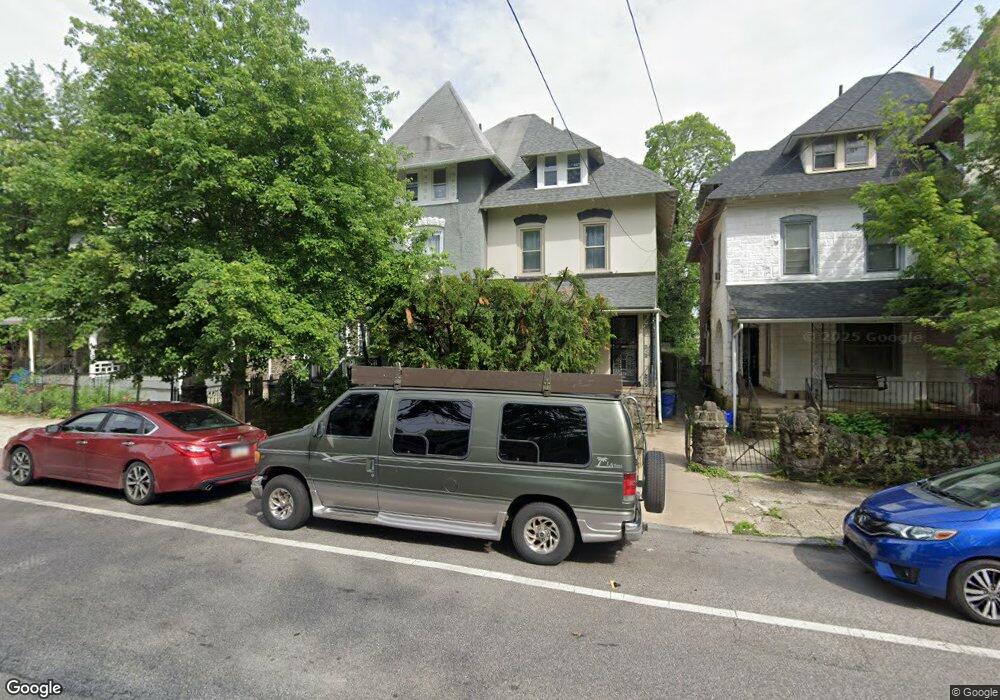
72 W Johnson St Philadelphia, PA 19144
Germantown NeighborhoodEstimated Value: $369,000 - $417,323
4
Beds
2
Baths
2,073
Sq Ft
$190/Sq Ft
Est. Value
About This Home
This home is located at 72 W Johnson St, Philadelphia, PA 19144 and is currently estimated at $394,581, approximately $190 per square foot. 72 W Johnson St is a home located in Philadelphia County with nearby schools including Anna Lane Lingelbach School, Roxborough High School, and Blair Christian Academy.
Ownership History
Date
Name
Owned For
Owner Type
Purchase Details
Closed on
Apr 8, 2009
Sold by
Taylor Samantha and Taylor Jason
Bought by
Taylor Samantha and Taylor Jason
Current Estimated Value
Home Financials for this Owner
Home Financials are based on the most recent Mortgage that was taken out on this home.
Original Mortgage
$194,000
Outstanding Balance
$121,581
Interest Rate
4.86%
Mortgage Type
New Conventional
Estimated Equity
$273,000
Purchase Details
Closed on
Jan 19, 2007
Sold by
Warthen Andrew L and Warthen Angela R
Bought by
Haley Samantha and Taylor Jason
Home Financials for this Owner
Home Financials are based on the most recent Mortgage that was taken out on this home.
Original Mortgage
$141,750
Interest Rate
6.23%
Mortgage Type
Purchase Money Mortgage
Purchase Details
Closed on
Jun 16, 2000
Sold by
Shannon Donna E and Estate Of Ruth M Shannon
Bought by
Warthen Andrew L and Warthen Angela R
Home Financials for this Owner
Home Financials are based on the most recent Mortgage that was taken out on this home.
Original Mortgage
$77,710
Interest Rate
8.1%
Mortgage Type
FHA
Purchase Details
Closed on
Feb 14, 1995
Sold by
Alexander James A and Shannon Ruth
Bought by
Shannon Ruth
Create a Home Valuation Report for This Property
The Home Valuation Report is an in-depth analysis detailing your home's value as well as a comparison with similar homes in the area
Home Values in the Area
Average Home Value in this Area
Purchase History
| Date | Buyer | Sale Price | Title Company |
|---|---|---|---|
| Taylor Samantha | -- | None Available | |
| Haley Samantha | $189,000 | None Available | |
| Warthen Andrew L | $80,000 | -- | |
| Shannon Ruth | -- | -- |
Source: Public Records
Mortgage History
| Date | Status | Borrower | Loan Amount |
|---|---|---|---|
| Open | Taylor Samantha | $194,000 | |
| Closed | Haley Samantha | $141,750 | |
| Previous Owner | Warthen Andrew L | $77,710 |
Source: Public Records
Tax History Compared to Growth
Tax History
| Year | Tax Paid | Tax Assessment Tax Assessment Total Assessment is a certain percentage of the fair market value that is determined by local assessors to be the total taxable value of land and additions on the property. | Land | Improvement |
|---|---|---|---|---|
| 2026 | $4,148 | $368,200 | $73,640 | $294,560 |
| 2025 | $4,148 | $368,200 | $73,640 | $294,560 |
| 2024 | $4,148 | $368,200 | $73,640 | $294,560 |
| 2023 | $4,148 | $296,300 | $59,260 | $237,040 |
| 2022 | $2,107 | $251,300 | $59,260 | $192,040 |
| 2021 | $2,737 | $0 | $0 | $0 |
| 2020 | $2,737 | $0 | $0 | $0 |
| 2019 | $2,857 | $0 | $0 | $0 |
| 2018 | $2,707 | $0 | $0 | $0 |
| 2017 | $2,707 | $0 | $0 | $0 |
| 2016 | $2,287 | $0 | $0 | $0 |
| 2015 | $2,416 | $0 | $0 | $0 |
| 2014 | -- | $210,300 | $42,388 | $167,912 |
| 2012 | -- | $19,648 | $5,224 | $14,424 |
Source: Public Records
Map
Nearby Homes
- 47 W Pomona St
- 102 W Cliveden St
- 32 W Pomona St
- 10 W Pomona St
- 58 W Pomona St
- 133 W Duval St
- 6347 Mccallum St
- 75 E Duval St
- 126 W Pomona St
- 132 W Pomona St
- 6339 Baynton St
- 28 E Johnson St
- 67 W Duval St
- 141 W Upsal St
- 6317 Baynton St
- 120 E Duval St
- 50 E Johnson St
- 127 W Washington Ln
- 6227 Baynton St
- 64 E Johnson St
- 74 W Johnson St
- 70 W Johnson St
- 76 W Johnson St
- 80 W Johnson St
- 66 W Johnson St
- 62 W Johnson St
- 58 W Johnson St
- 53 W Duval St
- 55 W Duval St
- 51 W Duval St
- 49 W Duval St
- 57 W Duval St
- 60 W Johnson St
- 47 W Duval St
- 61 W Duval St
- 45 W Duval St
- 43 W Duval St
- 63 W Duval St
- 6363 Cherokee St
- 6361 Cherokee St