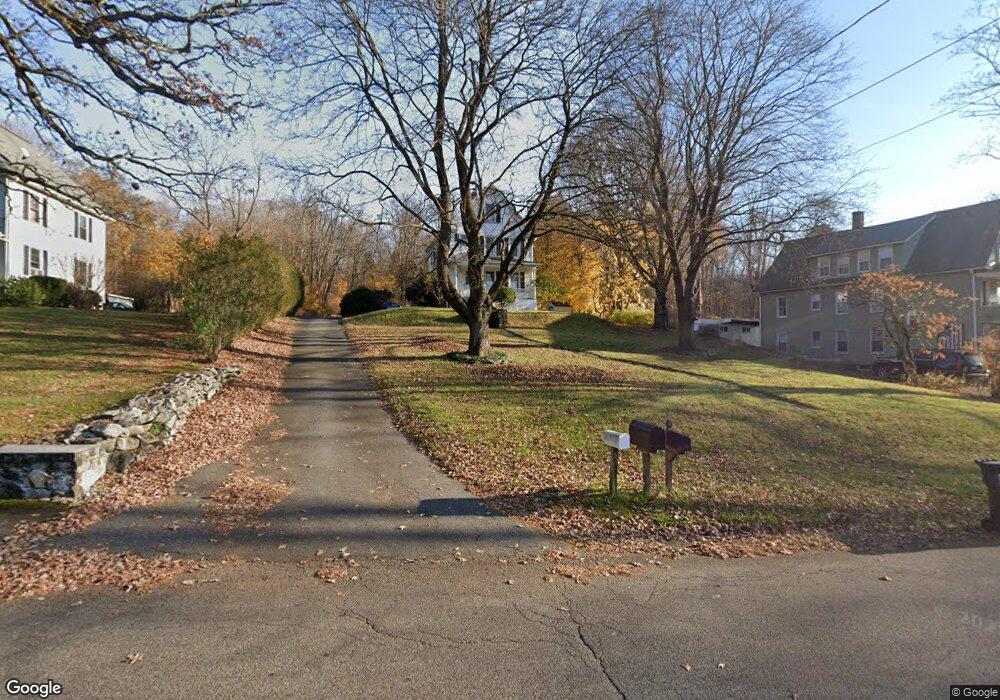
72 Walnut St Unit A Seymour, CT 06483
Estimated Value: $364,000 - $415,000
3
Beds
3
Baths
1,352
Sq Ft
$283/Sq Ft
Est. Value
About This Home
This home is located at 72 Walnut St Unit A, Seymour, CT 06483 and is currently estimated at $382,544, approximately $282 per square foot. 72 Walnut St Unit A is a home located in New Haven County with nearby schools including Seymour Middle School, Seymour High School, and Assumption School.
Ownership History
Date
Name
Owned For
Owner Type
Purchase Details
Closed on
Apr 30, 2025
Sold by
Urban Anna B and Seymour Town Of
Bought by
Leggio Robert
Current Estimated Value
Purchase Details
Closed on
Mar 25, 2022
Sold by
Davis Ralph
Bought by
Davis Ralph and Davis Jennifer
Purchase Details
Closed on
Jun 30, 2014
Sold by
Newman Gregory E
Bought by
Davis Ralph and Davis Jennifer
Home Financials for this Owner
Home Financials are based on the most recent Mortgage that was taken out on this home.
Original Mortgage
$181,649
Interest Rate
4.19%
Mortgage Type
New Conventional
Purchase Details
Closed on
Jun 12, 2007
Sold by
Hehn Kenneth L
Bought by
Tottenham John E
Purchase Details
Closed on
Aug 20, 2004
Sold by
Drown Jill Est and Drown
Bought by
Newman Gregory E
Create a Home Valuation Report for This Property
The Home Valuation Report is an in-depth analysis detailing your home's value as well as a comparison with similar homes in the area
Home Values in the Area
Average Home Value in this Area
Purchase History
| Date | Buyer | Sale Price | Title Company |
|---|---|---|---|
| Leggio Robert | $65,000 | -- | |
| Leggio Robert | $65,000 | -- | |
| Davis Ralph | -- | None Available | |
| Davis Ralph | -- | None Available | |
| Davis Ralph | -- | None Available | |
| Davis Ralph | -- | None Available | |
| Davis Ralph | $185,000 | -- | |
| Davis Ralph | $185,000 | -- | |
| Davis Ralph | $185,000 | -- | |
| Davis Ralph | $185,000 | -- | |
| Tottenham John E | $5,000 | -- | |
| Tottenham John E | $5,000 | -- | |
| Newman Gregory E | $28,750 | -- | |
| Newman Gregory E | $28,750 | -- | |
| Davis Ralph | $185,000 | -- | |
| Tottenham John E | $5,000 | -- | |
| Newman Gregory E | $28,750 | -- | |
| Davis Ralph | $185,000 | -- | |
| Tottenham John E | $5,000 | -- | |
| Newman Gregory E | $28,750 | -- |
Source: Public Records
Mortgage History
| Date | Status | Borrower | Loan Amount |
|---|---|---|---|
| Previous Owner | Davis Ralph | $181,649 |
Source: Public Records
Tax History
| Year | Tax Paid | Tax Assessment Tax Assessment Total Assessment is a certain percentage of the fair market value that is determined by local assessors to be the total taxable value of land and additions on the property. | Land | Improvement |
|---|---|---|---|---|
| 2025 | $5,895 | $212,660 | $35,980 | $176,680 |
| 2024 | $5,114 | $138,810 | $30,940 | $107,870 |
| 2023 | $4,994 | $138,810 | $30,940 | $107,870 |
| 2022 | $4,940 | $138,810 | $30,940 | $107,870 |
| 2021 | $4,818 | $138,810 | $30,940 | $107,870 |
| 2020 | $4,549 | $126,350 | $36,330 | $90,020 |
| 2019 | $4,549 | $126,350 | $36,330 | $90,020 |
| 2018 | $4,549 | $126,350 | $36,330 | $90,020 |
| 2017 | $4,549 | $126,350 | $36,330 | $90,020 |
| 2016 | $4,549 | $126,350 | $36,330 | $90,020 |
| 2015 | $4,518 | $130,620 | $40,600 | $90,020 |
| 2014 | $4,446 | $130,620 | $40,600 | $90,020 |
Source: Public Records
Map
Nearby Homes
- 72 Walnut St
- 72 Walnut St
- 72 Walnut St
- 72-a Walnut St
- 90 Walnut St
- 18 Walnut Street Extension
- 88 Walnut St
- 15A Walnut St
- 80 Walnut St
- 52 Walnut St
- 13 Walnut Street Extension
- 64 Walnut St
- 64 Walnut St
- 64 Walnut St Unit 2
- 86 Walnut St
- 62 Walnut St Unit 2nd Floor
- 62 Walnut St Unit 66
- 62 Walnut St Unit walnut st 1
Your Personal Tour Guide
Ask me questions while you tour the home.