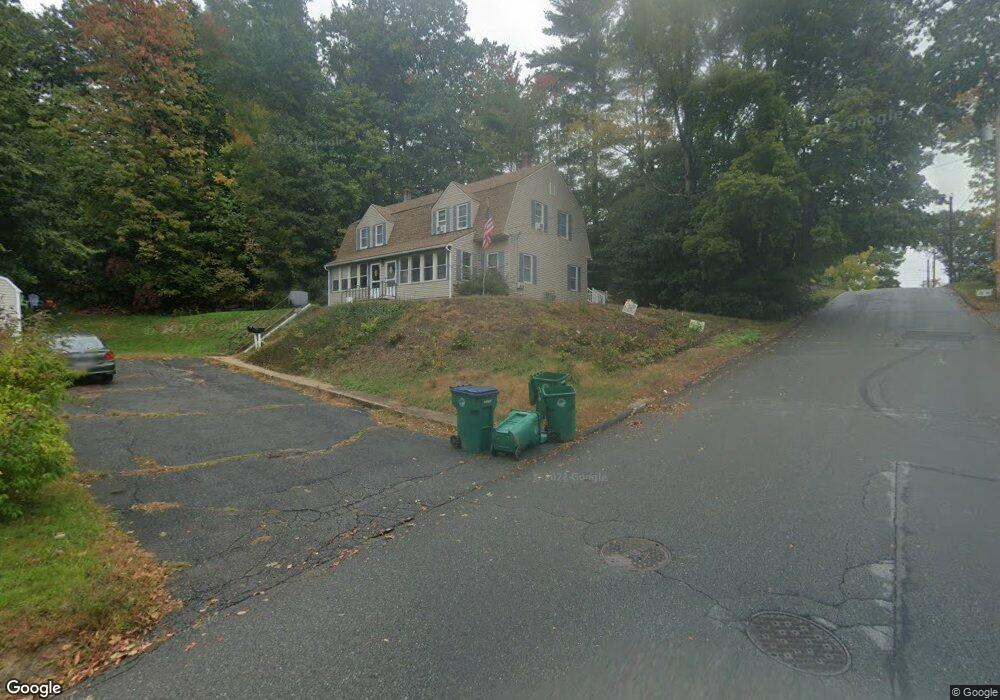
72 Ward St Unit 74 Fitchburg, MA 01420
Estimated Value: $508,316 - $639,000
6
Beds
2
Baths
2,640
Sq Ft
$208/Sq Ft
Est. Value
About This Home
This home is located at 72 Ward St Unit 74, Fitchburg, MA 01420 and is currently estimated at $549,829, approximately $208 per square foot. 72 Ward St Unit 74 is a home located in Worcester County with nearby schools including Reingold Elementary School, South Street Elementary School, and Crocker Elementary School.
Ownership History
Date
Name
Owned For
Owner Type
Purchase Details
Closed on
Sep 23, 2025
Sold by
Mastyk Kristal E
Bought by
Thomas Laneia G
Current Estimated Value
Home Financials for this Owner
Home Financials are based on the most recent Mortgage that was taken out on this home.
Original Mortgage
$412,500
Outstanding Balance
$411,637
Interest Rate
5.75%
Mortgage Type
New Conventional
Estimated Equity
$138,192
Purchase Details
Closed on
Oct 13, 2021
Sold by
Dalbec Kristal E and Dalbec Matthew J
Bought by
Dalbec Kristal E
Home Financials for this Owner
Home Financials are based on the most recent Mortgage that was taken out on this home.
Original Mortgage
$212,350
Interest Rate
2.8%
Mortgage Type
New Conventional
Purchase Details
Closed on
Mar 31, 2006
Sold by
Jg Rt and Guertin
Bought by
Dalbec Kristal E and Dalbec Matthew J
Home Financials for this Owner
Home Financials are based on the most recent Mortgage that was taken out on this home.
Original Mortgage
$236,000
Interest Rate
6.32%
Mortgage Type
Purchase Money Mortgage
Create a Home Valuation Report for This Property
The Home Valuation Report is an in-depth analysis detailing your home's value as well as a comparison with similar homes in the area
Home Values in the Area
Average Home Value in this Area
Purchase History
| Date | Buyer | Sale Price | Title Company |
|---|---|---|---|
| Thomas Laneia G | $550,000 | -- | |
| Dalbec Kristal E | -- | None Available | |
| Dalbec Kristal E | -- | None Available | |
| Dalbec Kristal E | $295,000 | -- | |
| Dalbec Kristal E | $295,000 | -- | |
| Dalbec Kristal E | $295,000 | -- |
Source: Public Records
Mortgage History
| Date | Status | Borrower | Loan Amount |
|---|---|---|---|
| Open | Thomas Laneia G | $412,500 | |
| Previous Owner | Dalbec Kristal E | $212,350 | |
| Previous Owner | Dalbec Kristal E | $220,050 | |
| Previous Owner | Dalbec Kristal E | $236,000 | |
| Previous Owner | Dalbec Kristal E | $29,450 |
Source: Public Records
Tax History Compared to Growth
Tax History
| Year | Tax Paid | Tax Assessment Tax Assessment Total Assessment is a certain percentage of the fair market value that is determined by local assessors to be the total taxable value of land and additions on the property. | Land | Improvement |
|---|---|---|---|---|
| 2025 | $6,215 | $460,000 | $104,800 | $355,200 |
| 2024 | $6,004 | $405,400 | $74,500 | $330,900 |
| 2023 | $5,753 | $359,100 | $64,100 | $295,000 |
| 2022 | $5,047 | $286,600 | $53,600 | $233,000 |
| 2021 | $4,813 | $252,900 | $38,700 | $214,200 |
| 2020 | $4,161 | $211,100 | $35,800 | $175,300 |
| 2019 | $3,940 | $192,300 | $50,700 | $141,600 |
| 2018 | $3,853 | $183,400 | $47,700 | $135,700 |
| 2017 | $3,527 | $164,100 | $47,700 | $116,400 |
| 2016 | $3,356 | $158,100 | $43,200 | $114,900 |
| 2015 | $3,491 | $168,800 | $41,700 | $127,100 |
| 2014 | $3,405 | $171,700 | $41,700 | $130,000 |
Source: Public Records
Map
Nearby Homes
- 87 Roosevelt St
- 58 Cascade St
- 15 Cascade St
- 204 Roosevelt St
- 139 Parson Cir
- 17 Simonds Rd
- 7 Green Briar Rd Unit 7
- 1317 Westminster St
- 34 Oak Leaf Rd
- 19 Ashburnham St
- 35 Bernadette St
- 45 Norwood St
- 14 Felton St
- 87 Eaton St
- 592 Westminster Hill Rd
- 36 England Ave
- 429 Oak Hill Rd
- 57 Highview St
- 36 Miles St
- 358-360 Fairmount St
- 74 Ward St Unit 1
- 74 Ward St Unit 2
- 50 Roosevelt St Unit 52
- 28 Roosevelt St
- 77 Central Ave
- 58 Ward St Unit 60
- 58-60 Ward St
- 20 Roosevelt St
- 18 Roosevelt St
- Lot 13 Roosevelt
- 27 Roosevelt St
- 200 Central Ave
- 16 Roosevelt St
- 45 Central Ave
- 14 Roosevelt St
- 71 Central Ave
- 19 Roosevelt St
- 17 Roosevelt St
- 53 Ward St
- 77 Central Avenue Extension