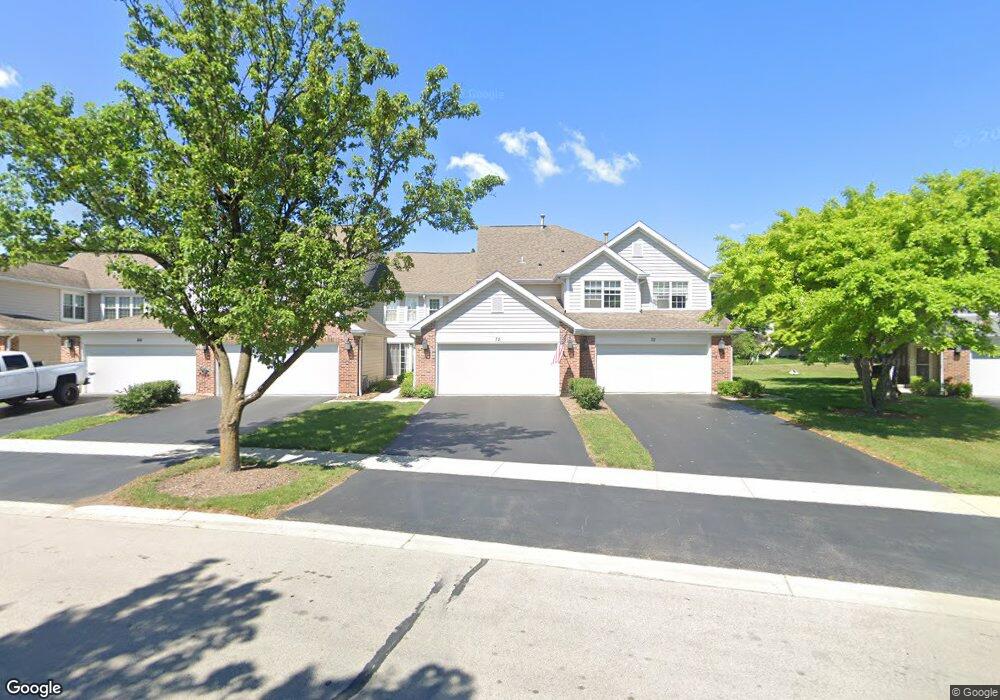
72 Whitman Dr Schaumburg, IL 60173
East Schaumburg NeighborhoodEstimated Value: $425,000 - $472,000
3
Beds
3
Baths
1,712
Sq Ft
$259/Sq Ft
Est. Value
About This Home
This home is located at 72 Whitman Dr, Schaumburg, IL 60173 and is currently estimated at $444,186, approximately $259 per square foot. 72 Whitman Dr is a home located in Cook County with nearby schools including Adolph Link Elementary School, Margaret Mead Junior High School, and J B Conant High School.
Ownership History
Date
Name
Owned For
Owner Type
Purchase Details
Closed on
Apr 29, 2020
Sold by
Majerczak Joseph and Drechsel Carol A
Bought by
Majerczak Joseph and The Joseph Majerczak Revocable
Current Estimated Value
Purchase Details
Closed on
Apr 12, 1996
Sold by
Smith Timothy M
Bought by
Majerczak Joseph and Drechsel Carol A
Home Financials for this Owner
Home Financials are based on the most recent Mortgage that was taken out on this home.
Original Mortgage
$50,000
Interest Rate
7.91%
Purchase Details
Closed on
Mar 23, 1995
Sold by
Ford Julie L
Bought by
Smith Timothy M
Home Financials for this Owner
Home Financials are based on the most recent Mortgage that was taken out on this home.
Original Mortgage
$156,600
Interest Rate
6.5%
Purchase Details
Closed on
Jan 21, 1994
Sold by
Ford Hershall J and Ford Julie L
Bought by
Ford Julie L
Purchase Details
Closed on
Sep 9, 1993
Sold by
Ford Julie L
Bought by
Ford Hershaw J and Ford Julie L
Create a Home Valuation Report for This Property
The Home Valuation Report is an in-depth analysis detailing your home's value as well as a comparison with similar homes in the area
Home Values in the Area
Average Home Value in this Area
Purchase History
| Date | Buyer | Sale Price | Title Company |
|---|---|---|---|
| Majerczak Joseph | -- | None Available | |
| Majerczak Joseph | $174,500 | Attorneys Natl Title Network | |
| Smith Timothy M | $174,000 | Attorneys Natl Title Network | |
| Ford Julie L | -- | -- | |
| Ford Hershaw J | -- | -- |
Source: Public Records
Mortgage History
| Date | Status | Borrower | Loan Amount |
|---|---|---|---|
| Closed | Majerczak Joseph | $50,000 | |
| Previous Owner | Smith Timothy M | $156,600 |
Source: Public Records
Tax History Compared to Growth
Tax History
| Year | Tax Paid | Tax Assessment Tax Assessment Total Assessment is a certain percentage of the fair market value that is determined by local assessors to be the total taxable value of land and additions on the property. | Land | Improvement |
|---|---|---|---|---|
| 2024 | $7,344 | $32,186 | $5,501 | $26,685 |
| 2023 | $7,835 | $35,000 | $5,500 | $29,500 |
| 2022 | $7,835 | $35,000 | $5,500 | $29,500 |
| 2021 | $6,322 | $26,854 | $6,875 | $19,979 |
| 2020 | $6,336 | $26,854 | $6,875 | $19,979 |
| 2019 | $6,343 | $29,838 | $6,875 | $22,963 |
| 2018 | $4,993 | $22,819 | $5,785 | $17,034 |
| 2017 | $4,946 | $22,819 | $5,785 | $17,034 |
| 2016 | $6,251 | $26,911 | $5,785 | $21,126 |
| 2015 | $6,947 | $27,719 | $5,031 | $22,688 |
| 2014 | $6,899 | $27,719 | $5,031 | $22,688 |
| 2013 | $6,692 | $27,719 | $5,031 | $22,688 |
Source: Public Records
Map
Nearby Homes
- 26 Egg Harbour Ct
- 1300 Woodside Ct Unit B1
- 1301 Timberwood Ct Unit D1
- 151 Brookston Dr Unit A2
- 263 Driftwood Ln Unit 2D
- 1257 Rosewood Ct Unit D1
- 327 Wildberry Ct Unit D2
- 15 Bar Harbour Rd Unit 4F
- 274 Buckingham Ct Unit D2
- 391 Thornhill Ct Unit B1
- 1264 Williamsburg Dr Unit D2
- 1254 Plum Tree Ct Unit A2
- 243 Spring Creek Cir Unit 462
- 1386 Scarboro Rd Unit 1102
- 373 Southbury Ct Unit D-1
- 1385 Scarboro Rd Unit 204
- 1527 Lexington Cir
- 1535 Columbine Dr Unit 1
- 307 University Ln Unit A
- 251 University Ln
- 80 Whitman Dr
- 70 Whitman Dr
- 84 Whitman Dr
- 88 Whitman Dr
- 66 Whitman Dr
- 64 Whitman Dr
- 1480 Sturgeon Bay Ct
- 92 Whitman Dr
- 52 Whitman Dr
- 52 Whitman Dr Unit 52
- 60 Whitman Dr
- 1476 Sturgeon Bay Ct
- 56 Whitman Dr
- 63 Whitman Dr
- 1472 Sturgeon Bay Ct
- 1468 Sturgeon Bay Ct
- 1461 Wyndham Cove Ln
- 1465 Wyndham Cove Ln
- 59 Whitman Dr
- 1469 Wyndham Cove Ln