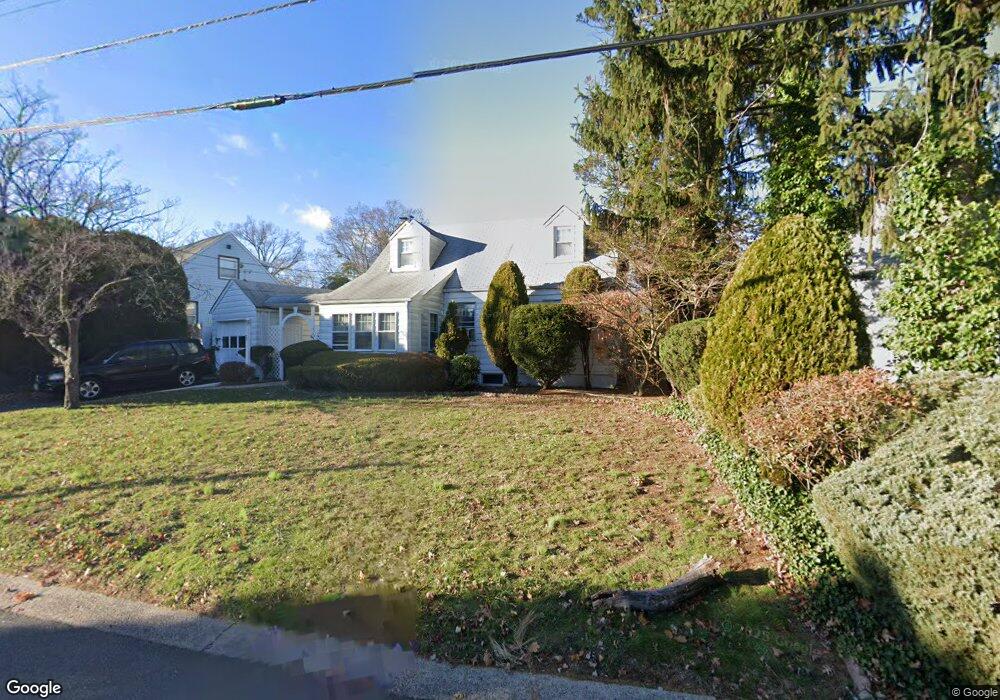
72 Wilkens Dr Dumont, NJ 07628
Estimated Value: $636,716 - $721,000
--
Bed
--
Bath
1,560
Sq Ft
$425/Sq Ft
Est. Value
About This Home
This home is located at 72 Wilkens Dr, Dumont, NJ 07628 and is currently estimated at $663,179, approximately $425 per square foot. 72 Wilkens Dr is a home located in Bergen County with nearby schools including Dumont High School.
Ownership History
Date
Name
Owned For
Owner Type
Purchase Details
Closed on
May 23, 2025
Sold by
Cino Maureen Leonidas
Bought by
Cino Maureen Leonidas
Current Estimated Value
Home Financials for this Owner
Home Financials are based on the most recent Mortgage that was taken out on this home.
Original Mortgage
$356,125
Outstanding Balance
$354,322
Interest Rate
4.75%
Mortgage Type
FHA
Estimated Equity
$308,857
Purchase Details
Closed on
Dec 13, 2012
Sold by
Cino Maureen Leonidas
Bought by
Apablaza Karen
Purchase Details
Closed on
Jun 27, 2005
Create a Home Valuation Report for This Property
The Home Valuation Report is an in-depth analysis detailing your home's value as well as a comparison with similar homes in the area
Home Values in the Area
Average Home Value in this Area
Purchase History
| Date | Buyer | Sale Price | Title Company |
|---|---|---|---|
| Cino Maureen Leonidas | -- | None Listed On Document | |
| Cino Maureen Leonidas | -- | None Listed On Document | |
| Apablaza Karen | $255,000 | -- | |
| -- | $96,000 | -- |
Source: Public Records
Mortgage History
| Date | Status | Borrower | Loan Amount |
|---|---|---|---|
| Open | Cino Maureen Leonidas | $356,125 | |
| Closed | Cino Maureen Leonidas | $356,125 |
Source: Public Records
Tax History Compared to Growth
Tax History
| Year | Tax Paid | Tax Assessment Tax Assessment Total Assessment is a certain percentage of the fair market value that is determined by local assessors to be the total taxable value of land and additions on the property. | Land | Improvement |
|---|---|---|---|---|
| 2025 | $11,789 | $481,000 | $298,900 | $182,100 |
| 2024 | $11,499 | $290,000 | $171,600 | $118,400 |
| 2023 | $11,261 | $290,000 | $171,600 | $118,400 |
| 2022 | $11,261 | $290,000 | $171,600 | $118,400 |
| 2021 | $11,206 | $290,000 | $171,600 | $118,400 |
| 2020 | $10,901 | $290,000 | $171,600 | $118,400 |
| 2019 | $10,640 | $290,000 | $171,600 | $118,400 |
| 2018 | $10,423 | $290,000 | $171,600 | $118,400 |
| 2017 | $10,223 | $290,000 | $171,600 | $118,400 |
| 2016 | $9,985 | $290,000 | $171,600 | $118,400 |
| 2015 | $9,756 | $290,000 | $171,600 | $118,400 |
| 2014 | $9,564 | $290,000 | $171,600 | $118,400 |
Source: Public Records
Map
Nearby Homes