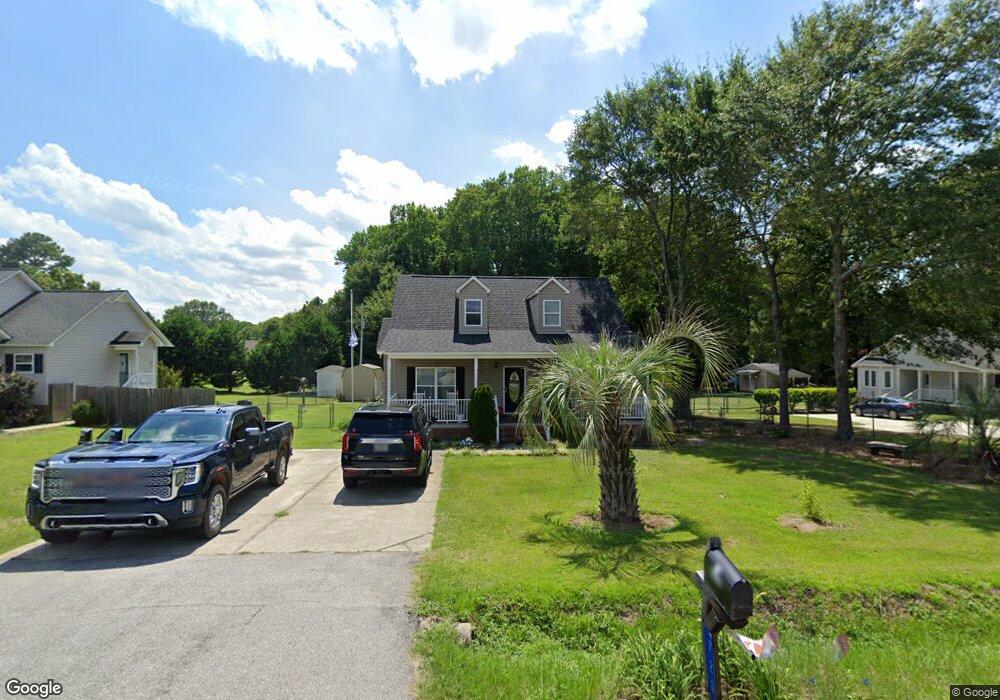
720 Ball Park Rd Lexington, SC 29072
Estimated Value: $271,000 - $317,000
3
Beds
3
Baths
1,795
Sq Ft
$166/Sq Ft
Est. Value
About This Home
This home is located at 720 Ball Park Rd, Lexington, SC 29072 and is currently estimated at $297,970, approximately $166 per square foot. 720 Ball Park Rd is a home located in Lexington County with nearby schools including Pleasant Hill Elementary School, Pleasant Hill Middle School, and Lexington High School.
Ownership History
Date
Name
Owned For
Owner Type
Purchase Details
Closed on
Jan 24, 2022
Sold by
Clark Wendi A
Bought by
Snelling Brandon Nicholas and Abbott Rachel
Current Estimated Value
Home Financials for this Owner
Home Financials are based on the most recent Mortgage that was taken out on this home.
Original Mortgage
$244,440
Outstanding Balance
$225,742
Interest Rate
3.11%
Mortgage Type
New Conventional
Estimated Equity
$72,228
Purchase Details
Closed on
Mar 2, 2006
Sold by
Fannie Mae
Bought by
Clark Wendi A
Home Financials for this Owner
Home Financials are based on the most recent Mortgage that was taken out on this home.
Original Mortgage
$25,950
Interest Rate
6.19%
Mortgage Type
Stand Alone Second
Purchase Details
Closed on
Dec 14, 2005
Sold by
Mckay Robert L and Kirk Michael S
Bought by
Federal National Mortgage Association
Purchase Details
Closed on
Oct 13, 2000
Sold by
Vaughn Kevin Scott
Bought by
Mckay Robert L
Create a Home Valuation Report for This Property
The Home Valuation Report is an in-depth analysis detailing your home's value as well as a comparison with similar homes in the area
Home Values in the Area
Average Home Value in this Area
Purchase History
| Date | Buyer | Sale Price | Title Company |
|---|---|---|---|
| Snelling Brandon Nicholas | $252,000 | Dooley Law Firm Pa | |
| Clark Wendi A | -- | None Available | |
| Federal National Mortgage Association | $130,000 | None Available | |
| Mckay Robert L | $120,000 | -- | |
| Sturkie Brothers Dev | $15,750 | -- |
Source: Public Records
Mortgage History
| Date | Status | Borrower | Loan Amount |
|---|---|---|---|
| Open | Snelling Brandon Nicholas | $244,440 | |
| Previous Owner | Clark Wendi A | $25,950 | |
| Previous Owner | Clark Wendi A | $103,900 |
Source: Public Records
Tax History Compared to Growth
Tax History
| Year | Tax Paid | Tax Assessment Tax Assessment Total Assessment is a certain percentage of the fair market value that is determined by local assessors to be the total taxable value of land and additions on the property. | Land | Improvement |
|---|---|---|---|---|
| 2024 | $1,505 | $10,080 | $1,000 | $9,080 |
| 2023 | $1,505 | $5,716 | $1,000 | $4,716 |
| 2022 | $852 | $5,716 | $1,000 | $4,716 |
| 2020 | $874 | $5,716 | $1,000 | $4,716 |
| 2019 | $837 | $5,375 | $800 | $4,575 |
| 2018 | $821 | $5,375 | $800 | $4,575 |
| 2017 | $797 | $5,375 | $800 | $4,575 |
| 2016 | $789 | $5,375 | $800 | $4,575 |
| 2014 | $805 | $5,738 | $800 | $4,938 |
| 2013 | -- | $5,740 | $800 | $4,940 |
Source: Public Records
Map
Nearby Homes
- 122 Harvest Hill Trail
- 526 Deer Park Ln
- 317 Nehemiah Rd
- 313 Nehemiah Rd
- 305 Nehemiah Rd
- 619 Barr Rd
- 208 Bailey Island Cir
- 207 Nehemiah Rd
- 226 Luna Trail
- 300 Tisbury Ct
- 242 Yale Rd
- 357 Southberry Way
- 4 Edge St
- 710 Barr Lake Dr
- 205 Inverness Ct
- 105 Alcott Ct
- 168 Royal Lythan Dr
- 436 Rainbow Shad Way
- 440 Rainbow Shad Way
- 472 Rainbow Shad Way
- 724 Ball Park Rd
- 726 Ball Park Rd
- 728 Ball Park Rd
- 732 Ball Park Rd
- 721 Ball Park Rd
- 729 Ball Park Rd
- 725 Ball Park Rd
- 733 Ball Park Rd
- 714 Ball Park Rd
- 737 Ball Park Rd
- 736 Ball Park Rd
- 717 Ball Park Rd
- 520 Rawl Rd
- 740 Ball Park Rd
- 713 Ball Park Rd
- 420 Rawl Rd
- 212 Juanita Dr
- 209 Belinda Ct
- 208 Juanita Dr
- 416 Rawl Rd