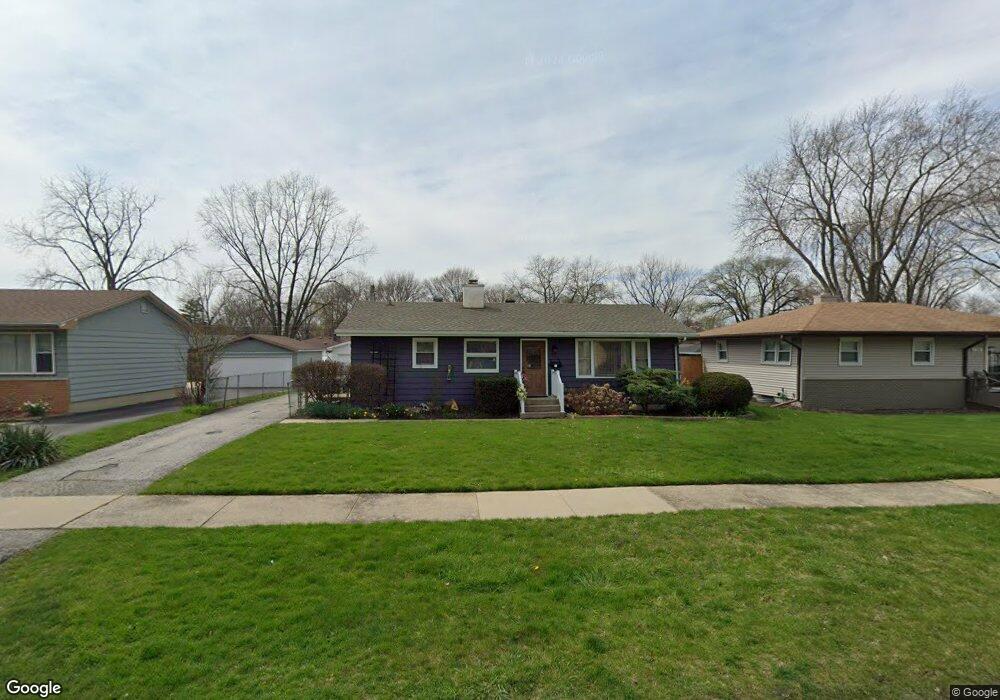
720 Cypress Dr Aurora, IL 60506
Edgelawn Randall NeighborhoodEstimated Value: $270,000 - $283,000
3
Beds
1
Bath
959
Sq Ft
$287/Sq Ft
Est. Value
About This Home
This home is located at 720 Cypress Dr, Aurora, IL 60506 and is currently estimated at $275,585, approximately $287 per square foot. 720 Cypress Dr is a home located in Kane County with nearby schools including Hall Elementary School, Jefferson Middle School, and West Aurora High School.
Ownership History
Date
Name
Owned For
Owner Type
Purchase Details
Closed on
Sep 11, 2011
Sold by
Secretary Of Housing & Urban Development
Bought by
Tapia Rigoberto
Current Estimated Value
Home Financials for this Owner
Home Financials are based on the most recent Mortgage that was taken out on this home.
Original Mortgage
$53,605
Interest Rate
4.12%
Mortgage Type
FHA
Purchase Details
Closed on
May 17, 2010
Sold by
Sams Shirley
Bought by
Secretary Of Housing & Urban Development
Purchase Details
Closed on
Jul 30, 2002
Sold by
Mccormick Judith A
Bought by
Sams Shirley
Home Financials for this Owner
Home Financials are based on the most recent Mortgage that was taken out on this home.
Original Mortgage
$107,900
Interest Rate
8.6%
Create a Home Valuation Report for This Property
The Home Valuation Report is an in-depth analysis detailing your home's value as well as a comparison with similar homes in the area
Home Values in the Area
Average Home Value in this Area
Purchase History
| Date | Buyer | Sale Price | Title Company |
|---|---|---|---|
| Tapia Rigoberto | -- | Stewart Title Company | |
| Secretary Of Housing & Urban Development | -- | None Available | |
| Sams Shirley | $135,000 | First American Title Co |
Source: Public Records
Mortgage History
| Date | Status | Borrower | Loan Amount |
|---|---|---|---|
| Previous Owner | Tapia Rigoberto | $53,605 | |
| Previous Owner | Sams Shirley | $107,900 | |
| Closed | Sams Shirley | $26,975 |
Source: Public Records
Tax History Compared to Growth
Tax History
| Year | Tax Paid | Tax Assessment Tax Assessment Total Assessment is a certain percentage of the fair market value that is determined by local assessors to be the total taxable value of land and additions on the property. | Land | Improvement |
|---|---|---|---|---|
| 2024 | $4,977 | $70,856 | $13,260 | $57,596 |
| 2023 | $4,738 | $63,310 | $11,848 | $51,462 |
| 2022 | $4,582 | $57,764 | $10,810 | $46,954 |
| 2021 | $4,365 | $53,779 | $10,064 | $43,715 |
| 2020 | $4,115 | $49,953 | $9,348 | $40,605 |
| 2019 | $3,939 | $46,283 | $8,661 | $37,622 |
| 2018 | $3,356 | $39,613 | $8,011 | $31,602 |
| 2017 | $3,669 | $41,652 | $7,381 | $34,271 |
| 2016 | $3,353 | $37,561 | $6,327 | $31,234 |
| 2015 | -- | $32,839 | $5,441 | $27,398 |
| 2014 | -- | $30,706 | $5,233 | $25,473 |
| 2013 | -- | $31,134 | $5,158 | $25,976 |
Source: Public Records
Map
Nearby Homes
- 1747 W Illinois Ave
- 1751 Greene Ct
- 1735 Greene Ct
- 630 N Buell Ave
- 113 Stonewood Place Unit 6D
- 2220 Mayflower Dr
- 115 Hillwood Place Unit 4B
- 972 Westgate Dr
- 1730 W Galena Blvd Unit 402E
- 1120 Emerald Dr
- 833 N Randall Rd Unit C4
- 1389 Monomoy St Unit B2
- 1035 Newcastle Ln
- 960 Sapphire Ln
- 964 Sapphire Ln
- 967 Sapphire Ln
- 959 Sapphire Ln
- 963 Sapphire Ln
- 1543 W Downer Place
- 1390 N Glen Cir Unit B
- 716 Cypress Dr
- 726 Cypress Dr
- 719 Redwood Dr
- 710 Cypress Dr
- 732 Cypress Dr
- 715 Redwood Dr Unit II
- 725 Redwood Dr
- 709 Redwood Dr
- 731 Redwood Dr
- 719 Cypress Dr
- 736 Cypress Dr Unit 2
- 704 Cypress Dr Unit 2
- 715 Cypress Dr Unit 2
- 725 Cypress Dr Unit 2
- 735 Redwood Dr
- 709 Cypress Dr
- 703 Redwood Dr
- 731 Cypress Dr
- 742 Cypress Dr
- 1815 W Illinois Ave