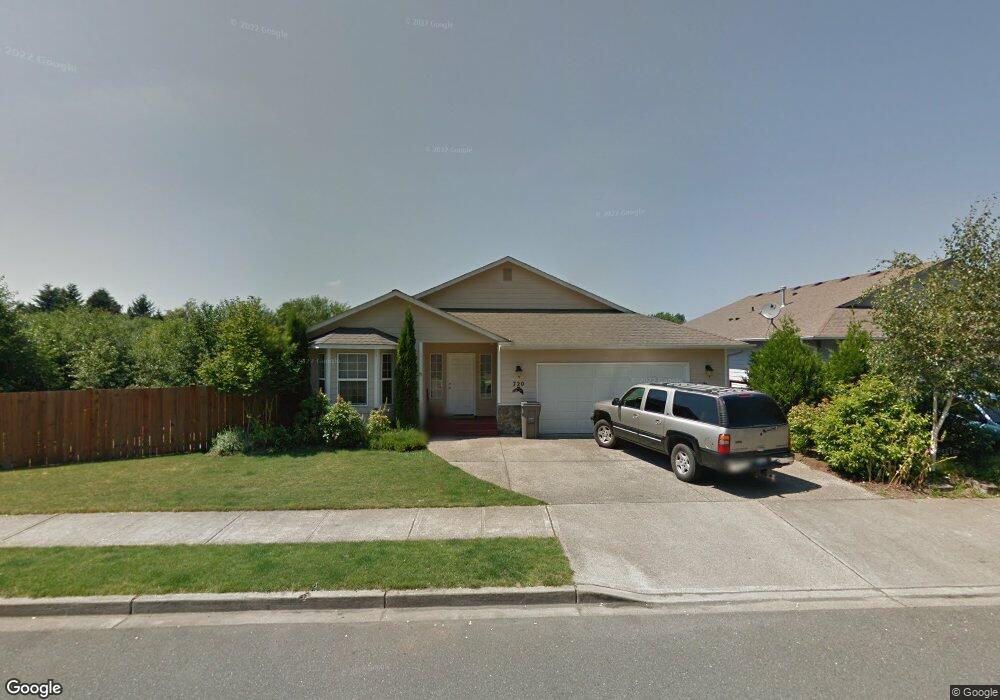
720 Darwins Way Granite Falls, WA 98252
Estimated Value: $667,000 - $702,437
3
Beds
3
Baths
3,442
Sq Ft
$200/Sq Ft
Est. Value
About This Home
This home is located at 720 Darwins Way, Granite Falls, WA 98252 and is currently estimated at $689,359, approximately $200 per square foot. 720 Darwins Way is a home located in Snohomish County with nearby schools including Mountain Way Elementary School, Granite Falls Middle School, and Granite Falls High School.
Ownership History
Date
Name
Owned For
Owner Type
Purchase Details
Closed on
Dec 27, 2010
Sold by
Parker Stephen R and Linsao Parker Riadel D
Bought by
Sperry Jaron and Sperry Jennifer R
Current Estimated Value
Home Financials for this Owner
Home Financials are based on the most recent Mortgage that was taken out on this home.
Original Mortgage
$227,979
Outstanding Balance
$152,122
Interest Rate
4.34%
Mortgage Type
New Conventional
Estimated Equity
$537,237
Purchase Details
Closed on
Jul 16, 2007
Sold by
C W Bright Construction Inc
Bought by
Parker Stephen R and Linsao Parker Riadel D
Home Financials for this Owner
Home Financials are based on the most recent Mortgage that was taken out on this home.
Original Mortgage
$55,500
Interest Rate
6.66%
Mortgage Type
Stand Alone Second
Create a Home Valuation Report for This Property
The Home Valuation Report is an in-depth analysis detailing your home's value as well as a comparison with similar homes in the area
Home Values in the Area
Average Home Value in this Area
Purchase History
| Date | Buyer | Sale Price | Title Company |
|---|---|---|---|
| Sperry Jaron | $220,280 | Stewart Title Company | |
| Parker Stephen R | $370,000 | Chicago |
Source: Public Records
Mortgage History
| Date | Status | Borrower | Loan Amount |
|---|---|---|---|
| Open | Sperry Jaron | $227,979 | |
| Previous Owner | Parker Stephen R | $55,500 | |
| Previous Owner | Parker Stephen R | $296,000 |
Source: Public Records
Tax History Compared to Growth
Tax History
| Year | Tax Paid | Tax Assessment Tax Assessment Total Assessment is a certain percentage of the fair market value that is determined by local assessors to be the total taxable value of land and additions on the property. | Land | Improvement |
|---|---|---|---|---|
| 2025 | $5,421 | $675,000 | $236,900 | $438,100 |
| 2024 | $5,421 | $615,400 | $192,000 | $423,400 |
| 2023 | $5,452 | $664,700 | $227,000 | $437,700 |
| 2022 | $5,103 | $506,100 | $157,000 | $349,100 |
| 2020 | $5,093 | $426,100 | $121,000 | $305,100 |
| 2019 | $4,585 | $405,100 | $120,000 | $285,100 |
| 2018 | $4,733 | $357,300 | $90,000 | $267,300 |
| 2017 | $4,218 | $320,600 | $71,000 | $249,600 |
| 2016 | $4,122 | $298,400 | $56,000 | $242,400 |
| 2015 | $4,003 | $278,700 | $48,000 | $230,700 |
| 2013 | $3,288 | $208,500 | $41,000 | $167,500 |
Source: Public Records
Map
Nearby Homes
- 0 8XXX Washington 92
- 200 S Alder Ave Unit A
- 204 W Stanley St
- 201 S Kentucky Ave
- 208 W Galena St
- 201 W Stanley St
- 406 E Pioneer St Unit C
- 406 E Pioneer St Unit B
- 114 Tompkins Place
- 307 Portage Ave
- 102 W Grand St
- 202 W Grand St
- 0 xx Menzel Lake Rd
- 9402 Ray Gray Rd Unit A
- 17916 Maple St
- 420 Raybird Ave
- 11310 181st Dr NE
- 17803 Mill Valley Rd
- 8824 184th Ave NE
- 20112 S Monte Cristo Way
- 722 Darwins Way
- 724 Darwins Way
- 719 Darwins Way
- 721 Darwins Way
- 717 Darwins Way
- 723 Darwins Way
- 726 Darwins Way
- 715 Darwins Way
- 725 Darwins Way
- 802 Darwins Way
- 801 Darwins Way
- 711 N Indiana Ave
- 803 Darwins Way
- 804 Darwins Way
- 10320 Mountain Loop Hwy
- 714 N Indiana Ave
- 806 Darwins Way
- 204 Mountain View St
- 709 N Indiana Ave
- 10222 Mountain Loop Hwy