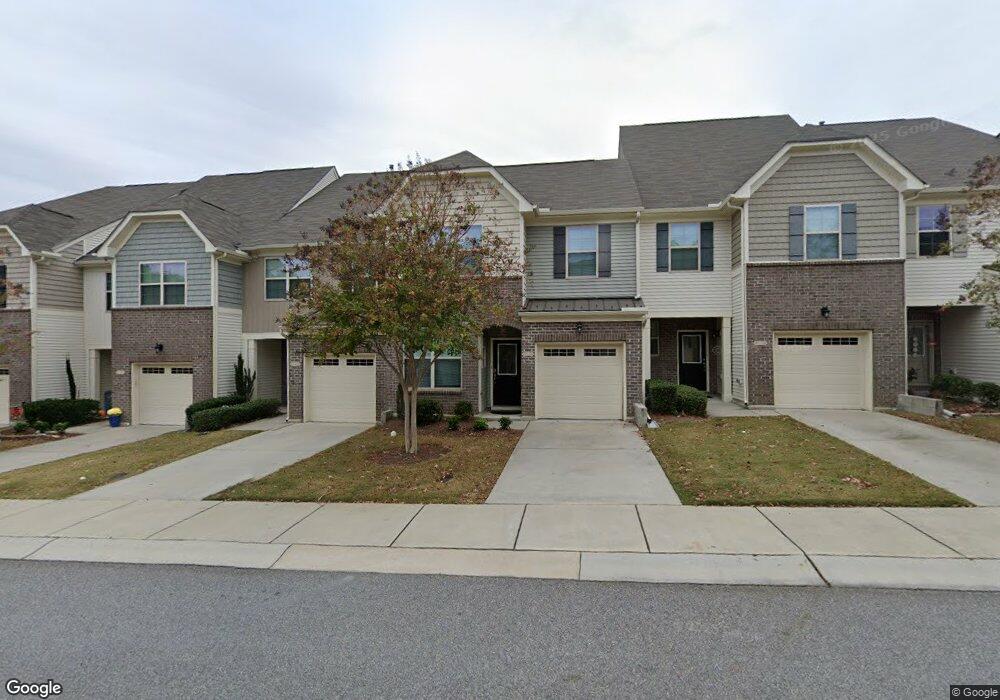
720 Davenbury Way Unit 121 Cary, NC 27513
South Cary NeighborhoodEstimated Value: $439,000 - $447,413
3
Beds
3
Baths
1,855
Sq Ft
$239/Sq Ft
Est. Value
About This Home
This home is located at 720 Davenbury Way Unit 121, Cary, NC 27513 and is currently estimated at $443,603, approximately $239 per square foot. 720 Davenbury Way Unit 121 is a home located in Wake County with nearby schools including Weatherstone Elementary School, East Cary Middle School, and Cary High School.
Ownership History
Date
Name
Owned For
Owner Type
Purchase Details
Closed on
Apr 30, 2025
Sold by
Gronewald Todd and Gronewald Tina
Bought by
Bhardwaj Peeyush and Bhardwaj Tara
Current Estimated Value
Purchase Details
Closed on
May 4, 2021
Sold by
Gronewald Todd and Gronewald Tina
Bought by
Gronewald Todd and Gronewald Tina
Purchase Details
Closed on
Apr 24, 2021
Sold by
Ali Imtiaz and Abdelaal Zeina Ahmed
Bought by
Gronewald Todd
Purchase Details
Closed on
Feb 23, 2015
Sold by
Standar Pacific Of The Carolinas Llc
Bought by
Ali Imtiaz and Abdelaal Zeina Ahmed
Home Financials for this Owner
Home Financials are based on the most recent Mortgage that was taken out on this home.
Original Mortgage
$161,500
Interest Rate
3.77%
Mortgage Type
New Conventional
Create a Home Valuation Report for This Property
The Home Valuation Report is an in-depth analysis detailing your home's value as well as a comparison with similar homes in the area
Home Values in the Area
Average Home Value in this Area
Purchase History
| Date | Buyer | Sale Price | Title Company |
|---|---|---|---|
| Bhardwaj Peeyush | $445,000 | None Listed On Document | |
| Bhardwaj Peeyush | $445,000 | None Listed On Document | |
| Gronewald Todd | -- | None Available | |
| Gronewald Todd | $330,000 | None Available | |
| Ali Imtiaz | $232,000 | None Available |
Source: Public Records
Mortgage History
| Date | Status | Borrower | Loan Amount |
|---|---|---|---|
| Previous Owner | Ali Imtiaz | $161,500 |
Source: Public Records
Tax History Compared to Growth
Tax History
| Year | Tax Paid | Tax Assessment Tax Assessment Total Assessment is a certain percentage of the fair market value that is determined by local assessors to be the total taxable value of land and additions on the property. | Land | Improvement |
|---|---|---|---|---|
| 2025 | -- | $432,042 | $90,000 | $342,042 |
| 2024 | $3,643 | $432,042 | $90,000 | $342,042 |
| 2023 | $3,090 | $306,420 | $60,000 | $246,420 |
| 2022 | $2,975 | $306,420 | $60,000 | $246,420 |
| 2021 | $2,916 | $306,420 | $60,000 | $246,420 |
| 2020 | $2,931 | $306,420 | $60,000 | $246,420 |
| 2019 | $2,628 | $243,612 | $55,000 | $188,612 |
| 2018 | $2,467 | $243,612 | $55,000 | $188,612 |
| 2017 | $2,371 | $243,612 | $55,000 | $188,612 |
| 2016 | $2,336 | $243,612 | $55,000 | $188,612 |
| 2015 | $880 | $89,400 | $32,000 | $57,400 |
Source: Public Records
Map
Nearby Homes
- 1009 Contessa Dr
- 1149 Contessa Dr
- 411 Weather Ridge Ln Unit 45
- 614 Weather Ridge Ln Unit 26
- 628 Weather Ridge Ln Unit 36
- 602 Weather Ridge Ln Unit 21
- 621 Weather Ridge Ln Unit 33
- 618 Weather Ridge Ln Unit 28
- 603 Weather Ridge Ln Unit 22
- 512 Weather Ridge Ln Unit 2
- 522 Weather Ridge Ln
- 3 Bedroom Condos Plan at Weatherstone Creek
- 2 Bedroom Condos Plan at Weatherstone Creek
- 316 Howland Ave
- 109 Ferris Wheel Ct
- 204 Phauff Ct
- 611 Weather Ridge Ln Unit 25
- 617 Weather Ridge Ln Unit 32
- 615 Weather Ridge Ln Unit 27
- 101 Joel Ct
- 722 Davenbury Way
- 718 Davenbury Way
- 724 Davenbury Way
- 724 Davenbury Way Unit 119
- 714 Davenbury Way
- 726 Davenbury Way
- 726 Davenbury Way Unit 118
- 712 Davenbury Way
- 712 Davenbury Way Unit 125
- 716 Davenbury Way
- 730 Davenbury Way
- 721 Davenbury Way
- 721 Davenbury Way Unit 114
- 723 Davenbury Way
- 719 Davenbury Way
- 719 Davenbury Way Unit 113
- 717 Davenbury Way
- 717 Davenbury Way Unit 112
- 725 Davenbury Way Unit 116
- 732 Davenbury Way