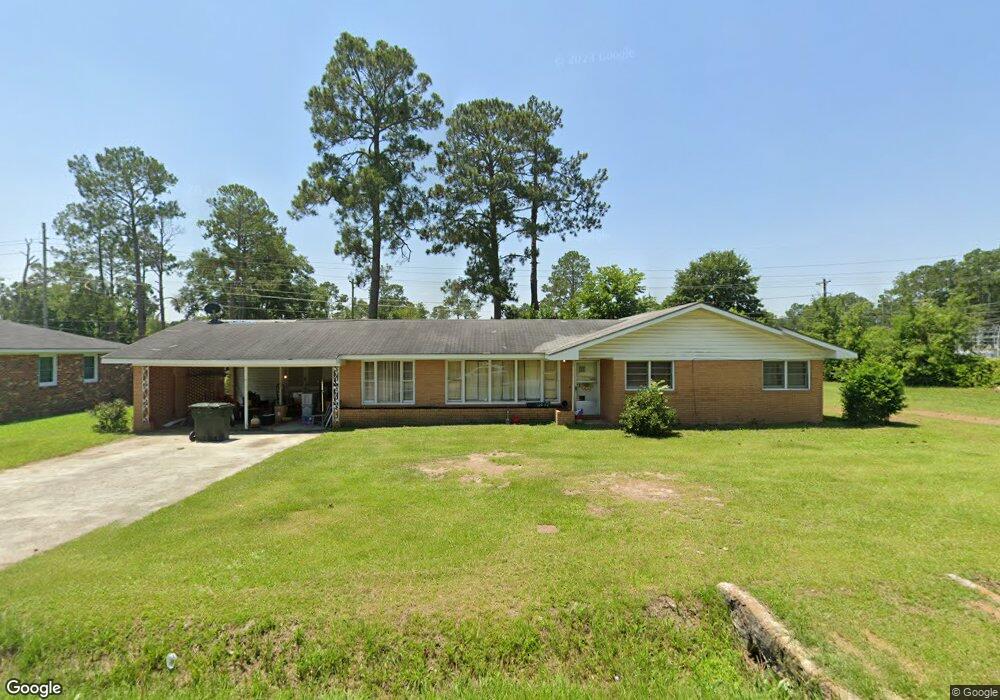
720 E 27th Ave Cordele, GA 31015
Estimated Value: $162,930 - $197,000
3
Beds
3
Baths
1,753
Sq Ft
$102/Sq Ft
Est. Value
About This Home
This home is located at 720 E 27th Ave, Cordele, GA 31015 and is currently estimated at $178,733, approximately $101 per square foot. 720 E 27th Ave is a home located in Crisp County with nearby schools including Crisp County Elementary School, Crisp County Primary School, and Crisp County Middle School.
Ownership History
Date
Name
Owned For
Owner Type
Purchase Details
Closed on
Jul 17, 2023
Sold by
Jackson Sheree
Bought by
Calhoun Tammy G and Calhoun George Kenneth
Current Estimated Value
Purchase Details
Closed on
Apr 23, 2021
Sold by
Jackson Brad
Bought by
Jackson Sheree
Purchase Details
Closed on
Dec 31, 2014
Sold by
Morgan Sheila Ann Jackson
Bought by
Jakson Brad
Purchase Details
Closed on
Dec 11, 2014
Sold by
Morgan Lanny Michael
Bought by
Morgan Michael Adam and Morgan Anna Alicia
Purchase Details
Closed on
Oct 15, 2001
Sold by
Morgan E L
Bought by
Morgan Dorothy J
Purchase Details
Closed on
Aug 31, 1988
Sold by
Morgan Dorothy J
Bought by
Morgan E L
Purchase Details
Closed on
Jul 22, 1985
Sold by
Morgan E L
Bought by
Morgan Dorothy J
Purchase Details
Closed on
Mar 30, 1977
Sold by
Kastis Thomas M and Kastis Gwendolyn
Bought by
Morgan E L
Create a Home Valuation Report for This Property
The Home Valuation Report is an in-depth analysis detailing your home's value as well as a comparison with similar homes in the area
Purchase History
| Date | Buyer | Sale Price | Title Company |
|---|---|---|---|
| Calhoun Tammy G | -- | -- | |
| Jackson Sheree | -- | -- | |
| Jakson Brad | -- | -- | |
| Morgan Michael Adam | -- | -- | |
| Morgan Michael Adam | -- | -- | |
| Jackson Sheila Ann Morgan | -- | -- | |
| Jackson Sheila Ann Morgan | -- | -- | |
| Morgan Dorothy J | -- | -- | |
| Morgan E L | -- | -- | |
| Morgan Dorothy J | -- | -- | |
| Morgan E L | -- | -- |
Source: Public Records
Tax History
| Year | Tax Paid | Tax Assessment Tax Assessment Total Assessment is a certain percentage of the fair market value that is determined by local assessors to be the total taxable value of land and additions on the property. | Land | Improvement |
|---|---|---|---|---|
| 2025 | $1,988 | $56,361 | $5,450 | $50,911 |
| 2024 | $1,844 | $51,457 | $5,450 | $46,007 |
| 2023 | $1,739 | $46,375 | $2,725 | $43,650 |
| 2022 | $1,161 | $43,923 | $2,725 | $41,198 |
| 2021 | $1,138 | $41,666 | $2,920 | $38,746 |
| 2020 | $1,173 | $41,666 | $2,920 | $38,746 |
| 2019 | $1,182 | $41,666 | $2,920 | $38,746 |
| 2018 | $999 | $33,877 | $4,672 | $29,205 |
| 2017 | $1,376 | $33,877 | $4,672 | $29,205 |
| 2016 | $1,002 | $33,877 | $4,672 | $29,205 |
| 2015 | -- | $33,877 | $4,672 | $29,205 |
| 2014 | -- | $33,877 | $4,672 | $29,205 |
| 2013 | -- | $33,876 | $4,672 | $29,204 |
Source: Public Records
Map
Nearby Homes
- 722 E 27th Ave
- 714 E 27th Ave
- 717 E 28th Ave
- 713 E 28th Ave
- 1710 S Hickory St
- 713 E 27th Ave
- 721 E 27th Ave
- 711 E 27th Ave
- 708 E 27th Ave
- 601 28th Ave E
- 802 E 27th Ave
- 703 E 27th Ave
- 1711 S Hickory St
- 801 E 27th Ave
- 714 E 28th Ave
- 718 E 26th Ave
- 712 E 28th Ave
- 702 E 27th Ave
- 714 E 26th Ave
- 716 E 28th Ave
Your Personal Tour Guide
Ask me questions while you tour the home.