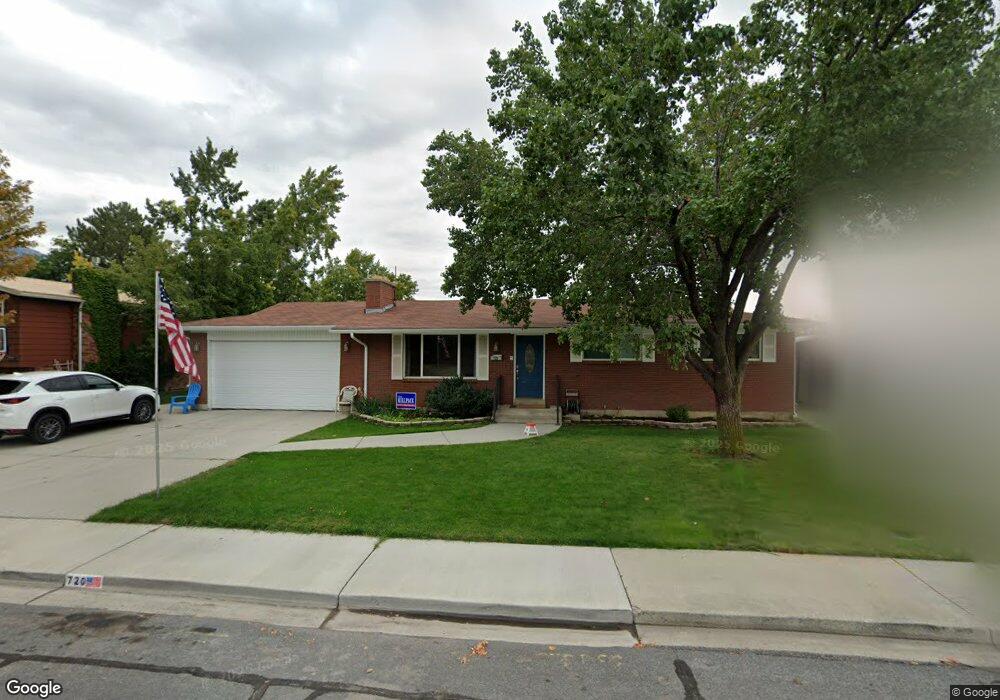
720 E 60 N Orem, UT 84097
Cascade NeighborhoodEstimated Value: $575,384 - $677,000
5
Beds
3
Baths
2,937
Sq Ft
$215/Sq Ft
Est. Value
About This Home
This home is located at 720 E 60 N, Orem, UT 84097 and is currently estimated at $631,128, approximately $214 per square foot. 720 E 60 N is a home located in Utah County with nearby schools including Cascade Elementary School, Canyon View Junior High School, and Orem High School.
Ownership History
Date
Name
Owned For
Owner Type
Purchase Details
Closed on
May 25, 2001
Sold by
First Security Bank Na
Bought by
Draper Lorey and Draper Naoma
Current Estimated Value
Home Financials for this Owner
Home Financials are based on the most recent Mortgage that was taken out on this home.
Original Mortgage
$127,900
Outstanding Balance
$48,182
Interest Rate
7.15%
Estimated Equity
$582,946
Purchase Details
Closed on
Oct 11, 2000
Sold by
Leifson Frank V and Leifson Maureen B
Bought by
First Security Bank Na
Create a Home Valuation Report for This Property
The Home Valuation Report is an in-depth analysis detailing your home's value as well as a comparison with similar homes in the area
Home Values in the Area
Average Home Value in this Area
Purchase History
| Date | Buyer | Sale Price | Title Company |
|---|---|---|---|
| Draper Lorey | -- | Empire Land Title Company | |
| First Security Bank Na | -- | First American Title Co |
Source: Public Records
Mortgage History
| Date | Status | Borrower | Loan Amount |
|---|---|---|---|
| Open | Draper Lorey | $127,900 | |
| Closed | Draper Lorey | $25,000 |
Source: Public Records
Tax History
| Year | Tax Paid | Tax Assessment Tax Assessment Total Assessment is a certain percentage of the fair market value that is determined by local assessors to be the total taxable value of land and additions on the property. | Land | Improvement |
|---|---|---|---|---|
| 2025 | $2,335 | $306,955 | -- | -- |
| 2024 | $2,335 | $285,505 | $0 | $0 |
| 2023 | $2,172 | $285,505 | $0 | $0 |
| 2022 | $2,124 | $270,435 | $0 | $0 |
| 2021 | $1,994 | $384,500 | $139,300 | $245,200 |
| 2020 | $1,856 | $351,800 | $111,400 | $240,400 |
| 2019 | $1,636 | $322,500 | $104,400 | $218,100 |
| 2018 | $1,585 | $298,400 | $100,900 | $197,500 |
| 2017 | $1,525 | $153,835 | $0 | $0 |
| 2016 | $1,582 | $147,125 | $0 | $0 |
| 2015 | $1,642 | $144,485 | $0 | $0 |
| 2014 | $1,645 | $144,100 | $0 | $0 |
Source: Public Records
Map
Nearby Homes
Your Personal Tour Guide
Ask me questions while you tour the home.